The Relative Strength Index (RSI) is one of the most widely used technical indicators in the world of trading. Developed by J. Welles Wilder Jr. in 1978, this momentum oscillator is a staple on the charts of retail and institutional traders alike.
However, a common pitfall for developing traders is relying on textbook definitions without accounting for market context.
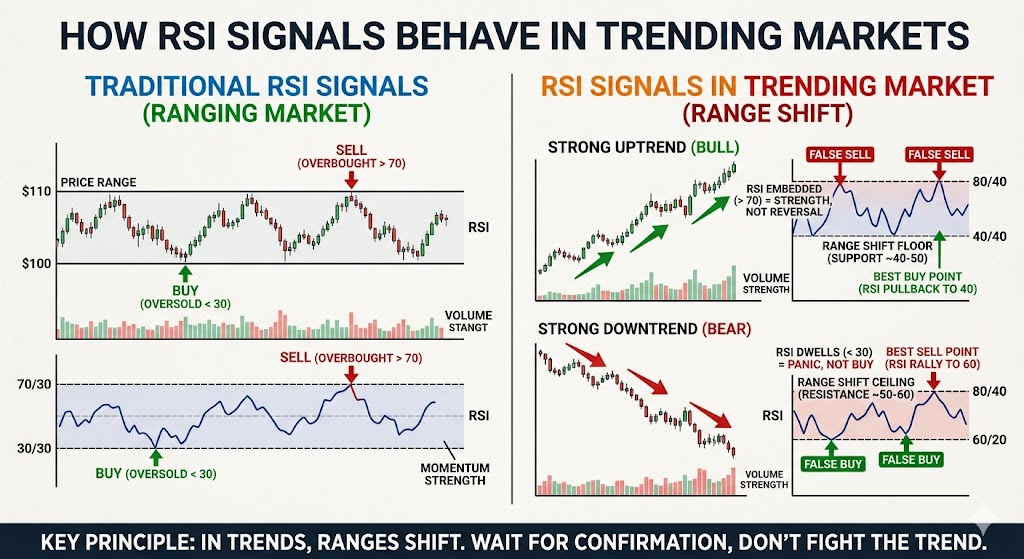
The standard rule of thumb—buying when the RSI dips below 30 (oversold) and selling when it rises above 70 (overbought)—works beautifully in range-bound, sideways markets. But when a strong, sustained trend takes over, these rules are completely rewritten.
If you treat a trending market like a ranging one, using the RSI will likely result in premature exits or, worse, fighting a runaway train. To avoid these traps, you must understand exactly how RSI signals behave in trending environments.
The Default Setup vs. Market Reality
The RSI measures the speed and magnitude of recent price changes on a scale of 0 to 100.
Ultima Markets
- Ranging Markets: Price bounces predictably between support and resistance. The RSI tracks this cleanly, hitting 70 at price tops and 30 at price bottoms. avatrade.ca
- Trending Markets: Price aggressively moves in one dominant direction. In these conditions, momentum shifts, and the RSI behaves like an anchor dragged behind a speed boat—it shifts its entire operating range upward or downward.
1. RSI Behavior in Strong Uptrends
In a powerful bull market, buying pressure is relentless. This fundamental shift alters how the RSI reflects momentum in three distinct ways:
The “Embedded” Overbought Signal
In a strong uptrend, the RSI will frequently cross above 70 and stay there for extended periods. Beginners often view an RSI of 75 or 80 as an immediate cue to short the asset. In reality, an overbought RSI in a trending market is a sign of extreme trend strength, not an imminent reversal. The price can continue to surge higher even as the RSI hovers in extreme territory.
Range Shifting (The 40–80 Rule)
As market theorist Andrew Cardwell noted, the RSI undergoes a “range shift” during sustained trends. In a healthy uptrend, the RSI rarely drops back down to the traditional 30 level. Instead, the 40–50 zone acts as the new floor (support).
During pullbacks within an uptrend, the RSI will typically bottom out near 40 before bouncing. Meanwhile, the upper threshold easily expands up to 80 or 85.
Re-defining the Buy Signal
Instead of waiting for an oversold reading that may never come, savvy trend-traders look for the RSI to pull back to the 40–50 mid-line, stabilize, and turn upward. This signals that the temporary correction is over and the primary uptrend is resuming.
2. RSI Behavior in Strong Downtrends
Conversely, a bear market or a strong macroeconomic markdown completely flips the indicator’s geometry.
Persistent “Oversold” Conditions
During a aggressive sell-off, panic selling drives prices down rapidly. The RSI will plunge below 30 and can stay suppressed in “oversold” territory for days or weeks. Buying an asset simply because the RSI is at 20 during a structural downtrend is a recipe for caught-falling-knife syndrome.
Range Shifting (The 20–60 Rule)
Just as uptrends shift the indicator higher, downtrends lock the RSI into a lower bracket. In a structural downtrend, the RSI will rarely break above the 60 level. The 50–60 zone acts as heavy resistance.
Relief rallies or dead-cat bounces will usually exhaust themselves as the RSI hits 60, while the indicator easily makes deeper dives down toward 20 or even 10.
3. The Nuance of Divergences in Trends
An RSI divergence occurs when price action and momentum signals fall out of sync. While highly reliable in sideways markets, divergences take on a different meaning when a market is trending.
Regular Divergences (False Reversal Signals)
A regular bearish divergence happens when the price makes a higher high, but the RSI makes a lower high. In an uptrend, traders often mistake this for a major trend reversal signal.
However, in a strong trend, regular divergences are frequently false alarms. They simply indicate that the trend is shifting from an explosive, parabolic phase into a steadier, more sustainable pace. The trend often continues upward despite the divergence.
Hidden Divergences (The Ultimate Trend Continuer)
While regular divergences trick traders into fighting the trend, hidden divergences are incredibly powerful tools for riding the trend.
- Hidden Bullish Divergence: Occurs when the price makes a higher low (showing structural strength), but the RSI makes a lower low. This indicates that even though momentum pulled back deeply, the buyers defended a higher price point. It is a highly reliable buy signal for trend continuation.
- Hidden Bearish Divergence: Occurs when the price makes a lower high, but the RSI makes a higher high. This suggests selling pressure remains dominant despite a sharp recovery in momentum, offering a prime short-selling entry.
Adapting Your Strategy: Best Practices for Trending Markets
To avoid getting chopped up by false RSI signals when a trend emerges, consider implementing these tactical adjustments:
- Shift Your Thresholds: Instead of the rigid 70/30 baseline, manually adjust your chart settings. Use 80/40 for clear bull markets to eliminate premature shorting, and 60/20 for bear markets to avoid catching falling knives.
- Pair with a Trend Filter: Never use the RSI in isolation. Combine it with a structural tool like a 50-day or 200-day Exponential Moving Average (EMA) or the Average Directional Index (ADX). If the ADX is above 25 (indicating a strong trend) and the price is above the 50 EMA, ignore overbought RSI sell signals entirely and only trade pullbacks.
- Wait for Price Confirmation: If the RSI pulls back to 40 in an uptrend, don’t just blindly hit buy. Wait for a bullish candlestick pattern (like a hammer or bullish engulfing candle) or a minor market structure break on a lower timeframe to confirm the buyers have actually stepped back in.
Conclusion
The Relative Strength Index is a phenomenal tool, but its signals are entirely dependent on the market regime. In trending markets, “overbought” means strong, and “oversold” means weak. By abandoning the rigid 70/30 textbook rules, adjusting your zones to accommodate range shifts, and focusing on hidden divergences, you can transform the RSI from a counter-trend trap into a highly effective trend-following ally.