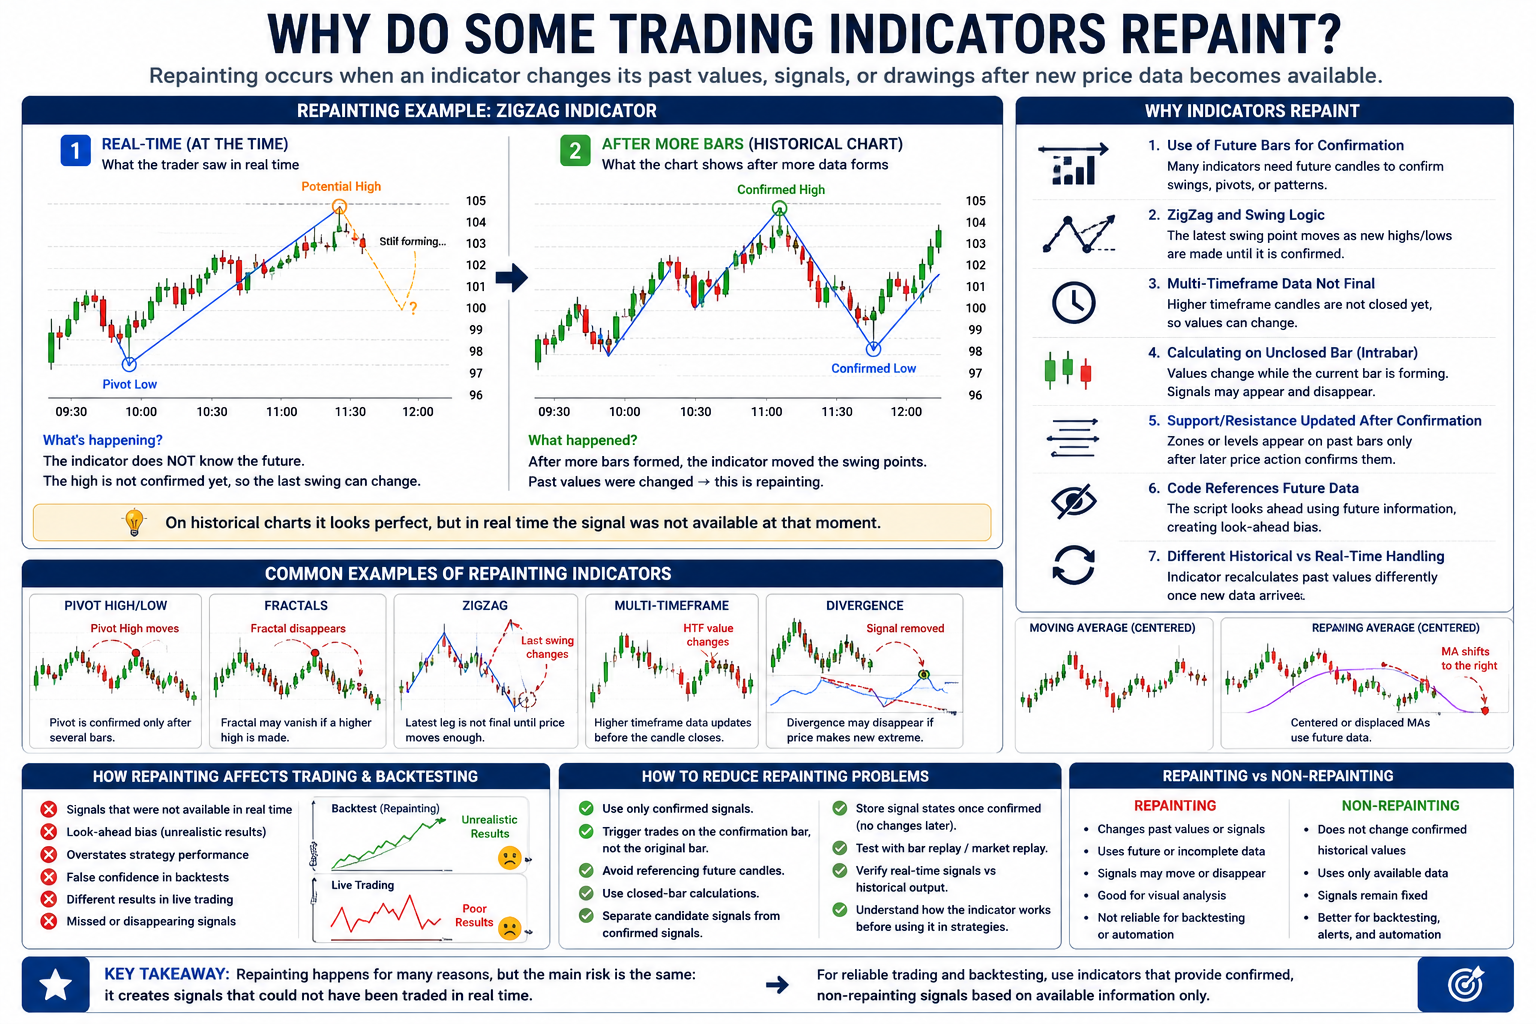
Repainting is a common behavior in technical indicators where past values, signals, or chart drawings change after new price data becomes available. For traders, this can be confusing because an indicator may look accurate on a historical chart but behave very differently in real time.
Some repainting is caused by poor coding practices, but not all repainting is necessarily a bug. In many cases, repainting happens because the indicator needs future bars to confirm a pattern, swing point, reversal, or higher-timeframe condition. Understanding why indicators repaint is important for anyone using technical analysis, backtesting strategies, or developing automated trading systems.
What Does Repainting Mean?
A trading indicator repaints when it changes previously displayed information after the bar has already closed or after more market data becomes available.
This can include:
- Moving a signal from one bar to another
- Removing a previous buy or sell signal
- Changing a historical indicator value
- Redrawing a support or resistance level
- Moving a swing high, swing low, or ZigZag point
- Updating a higher-timeframe signal before the higher-timeframe candle closes
The key issue is that the indicator’s historical output may not represent what the trader actually saw in real time.
Why Some Indicators Repaint
1. The Indicator Uses Future Bars for Confirmation
Many indicators need future candles to confirm a signal. For example, a swing high cannot be fully confirmed until several bars form after the potential high. If the indicator plots the signal back on the original high bar, it may look like the signal was available earlier than it really was.
This is common in pivot, fractal, swing, and reversal indicators.
The logic may be technically correct, but the visual signal can be misleading if the trader does not understand the confirmation delay.
2. ZigZag and Swing Indicators Adjust as Price Moves
ZigZag indicators are one of the most common examples of repainting indicators. A ZigZag line connects major price swings, but the most recent swing point is not final until price moves far enough in the opposite direction.
As new highs or lows form, the latest ZigZag point may move. This makes the chart look clean historically, but the latest turning point may not have been known in real time.
ZigZag-style indicators can be useful for market structure analysis, but they should be handled carefully in strategy backtesting.
3. Multi-Timeframe Data Is Not Final Yet
Multi-timeframe indicators can repaint when they use data from a higher timeframe before that higher-timeframe candle has closed.
For example, a 5-minute chart may display a signal based on a 1-hour candle. During the hour, the higher-timeframe value may change many times. A signal that appears during the hour may disappear before the hourly candle closes.
This is not always a coding error. It is a natural result of using unfinished higher-timeframe data.
4. The Indicator Calculates on the Current Unclosed Bar
Some indicators update on every tick while the current candle is still forming. Since the open, high, low, close, and volume of the current bar can change before the bar closes, the indicator value can also change.
For example, a signal may appear when price temporarily crosses a moving average, then disappear if price moves back before the candle closes.
This type of repainting is common in real-time indicators that calculate intrabar instead of waiting for the bar to close.
5. Support and Resistance Zones Are Updated After Confirmation
Some support and resistance indicators draw zones based on confirmed swing points, breakouts, reactions, or volume activity. Because these conditions may require several bars to confirm, the zone may appear on a previous candle only after later price action validates it.
This can make the indicator look very accurate historically, but the zone may not have been visible at the time price first touched it.
For strategy development, it is important to distinguish between the bar where the zone originated and the bar where the zone became confirmed.
6. The Code References Future Data
Some indicators repaint because the code directly or indirectly references future bars. This creates look-ahead bias.
For example, an indicator may check whether a high remains the highest point over the next several bars. If that future information is used to create a signal on the current bar, the signal is not real-time actionable.
This type of repainting is especially dangerous in backtesting because it can produce unrealistic results.
7. Historical and Real-Time Calculations Are Handled Differently
Some platforms process historical data differently from real-time data. An indicator may look stable after the chart reloads, but its live signals may have appeared, moved, or disappeared during real-time market updates.
This can happen when the script does not properly store signal states, handle bar close logic, or separate temporary signals from confirmed signals.
A reliable indicator should behave as consistently as possible between historical calculation and live market conditions.
Is Repainting Always Bad?
Repainting is not always bad. Some indicators repaint because they are designed for visual analysis rather than direct signal execution.
For example, ZigZag, pivot, and swing structure tools can be valuable for understanding market movement, identifying price legs, and studying historical structure. However, they should not be treated as real-time entry signals unless the confirmation logic is clearly defined.
Repainting becomes a problem when traders assume that historical signals were available in real time.
How Repainting Affects Trading Strategies
Repainting can seriously affect trading strategy performance because it may create signals that could not have been traded live.
This can lead to:
- Unrealistic backtest results
- False confidence in a strategy
- Perfect-looking historical entries
- Missed signals in live trading
- Signals that disappear after price changes
- Large differences between backtesting and real-time execution
For automated strategies, repainting can be especially harmful because the system depends on exact signal timing.
How to Reduce Repainting Problems
Traders and developers can reduce repainting issues by using confirmed, closed-bar logic whenever possible.
Best practices include:
- Use signals only after the bar closes
- Avoid referencing future candles
- Separate candidate signals from confirmed signals
- Do not backtest signals on the original bar if they are confirmed later
- Test the indicator in real time or with market replay
- Compare live signals with historical chart signals
- Store confirmed signal values so they do not change later
- Be careful with multi-timeframe indicators
- Understand whether the indicator is designed for analysis or execution
The most important rule is simple: a trading signal should only be used in a strategy if it existed at the time the trade decision was made.
Repainting vs. Non-Repainting Indicators
A non-repainting indicator does not change its confirmed historical signals after they are formed. Once a signal is printed and confirmed, it remains fixed.
A repainting indicator may continue adjusting its most recent values, especially when working with unfinished bars, future confirmation, or market structure logic.
Non-repainting indicators are generally better for backtesting, alerts, and automated trading. Repainting indicators can still be useful for visual analysis, but they require proper interpretation.
Conclusion
Some trading indicators repaint because they rely on future confirmation, unfinished candles, multi-timeframe data, swing-point logic, or dynamic recalculation. Repainting is not always a flaw, but it can become dangerous when traders use repainting signals for backtesting or automated strategy execution without understanding how the signals are formed.
To use indicators correctly, traders should know whether a signal is temporary, confirmed, or historically adjusted. For reliable backtesting and live trading, signals should be based only on information that was available at the time.
Understanding repainting helps traders avoid misleading charts, unrealistic strategy results, and false confidence in signals that may not exist in real-time market conditions.