In the world of technical analysis, looking at a single chart is like trying to drive a car while only looking through the rearview mirror. You might see where you’ve been, but you’re missing the “big picture” of the road ahead.
Multi-Timeframe (MTF) indicators are the solution to this tunnel vision. By layering data from higher timeframes onto your current trading chart, these tools provide a panoramic view of market sentiment, helping traders filter out “noise” and align with the dominant trend.
What is a Multi-Timeframe Indicator?
A standard indicator calculates its value based on the candles visible on your current chart (e.g., a 15-minute chart). An MTF indicator, however, pulls data from a different, usually higher, timeframe (e.g., a 4-hour or Daily chart) and plots it onto your lower timeframe view.
For example, you could be scalping on a 5-minute chart while simultaneously seeing the 200-period Moving Average from the Daily chart plotted right in front of you.
How MTF Indicators Function: Under the Hood
The mechanics of an MTF indicator rely on data synchronization. Here is how the process generally works:
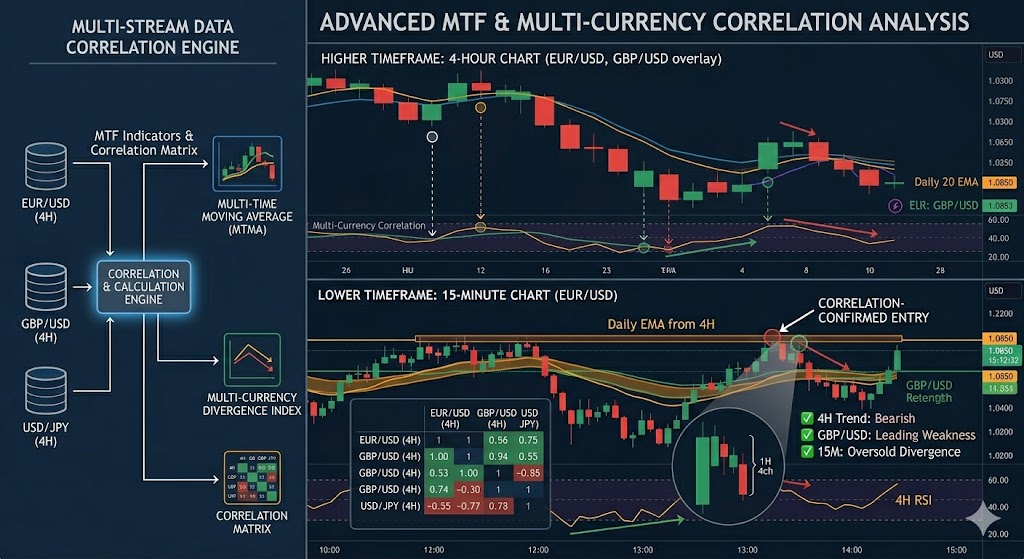
- Data Fetching: The indicator requests historical price data (Open, High, Low, Close) from a specified higher timeframe.
- Calculation: It runs its specific formula (RSI, MACD, Bollinger Bands, etc.) using that external data.
- Coordinate Mapping: Since a single 1-hour candle contains four 15-minute candles, the indicator must “stretch” the higher timeframe value across the corresponding lower timeframe bars.
- Real-time Updating: As the higher timeframe candle develops, the indicator updates dynamically on the lower timeframe chart.
The Benefits of Using MTF Indicators
Using MTF indicators isn’t just about having more lines on your screen; it’s about contextual clarity.
- Trend Confirmation: The golden rule of trading is “the trend is your friend.” MTF indicators allow you to ensure your short-term trade aligns with the long-term momentum.
- Reduced Market Noise: Lower timeframes are notorious for “fakeouts.” By using an MTF filter, you can ignore buy signals on a 1-minute chart if the 1-hour RSI shows the market is overbought.
- Precise Entries & Exits: You can use a higher timeframe to identify a major support zone and then use a lower timeframe indicator to “zoom in” and find the perfect entry point.
Popular MTF Strategies
| Strategy | How it Works |
|---|---|
| The MTF Moving Average | Plotting a Daily 20-period EMA on a 15-minute chart to identify “institutional” support levels. |
| MTF RSI Divergence | Looking for oversold conditions on the 4-hour chart while entering on a bullish crossover on the 15-minute chart. |
| The Triple Screen | Using indicators across three timeframes (e.g., Daily for trend, 1-hour for momentum, 5-minute for execution). |
A Note on “Repainting”
One technical hurdle with MTF indicators is repainting. Because a 1-hour candle isn’t “closed” until 60 minutes have passed, the indicator value pulled from that candle may shift or fluctuate on your 5-minute chart until the hour is up.
Pro Tip: Professional traders often wait for the higher timeframe candle to close before trusting the MTF indicator signal to avoid being caught in a repainted trap.
Conclusion
Multi-timeframe indicators are essential for any trader looking to move beyond basic retail strategies. By bridging the gap between short-term volatility and long-term structure, these tools offer a mathematical way to trade with the “smart money.” Whether you are a day trader or a swing trader, adding an MTF layer to your strategy can significantly increase your win rate and confidence.