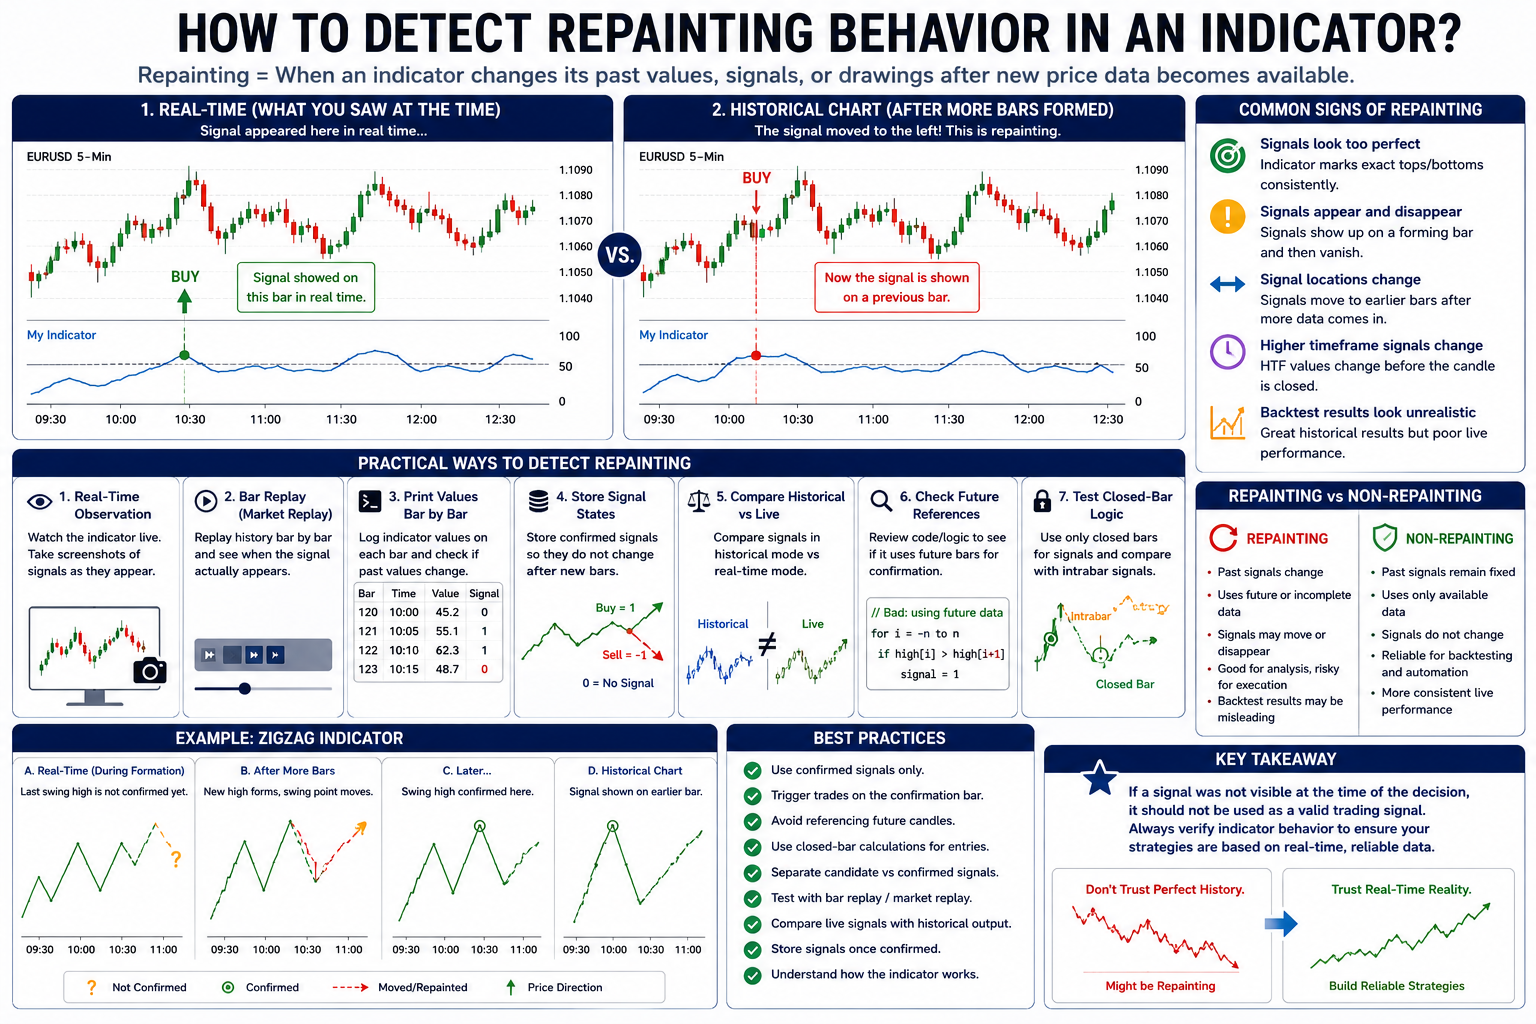
Repainting is one of the most important issues traders should understand when using technical indicators for chart analysis, alerts, backtesting, or automated trading. An indicator repaints when it changes its previous signals, values, or chart drawings after new price data becomes available.
At first glance, a repainting indicator may look highly accurate on a historical chart. It may appear to catch tops, bottoms, reversals, breakouts, and trend changes with impressive precision. However, the key question is whether those signals were actually available in real time.
Detecting repainting behavior helps traders avoid misleading signals, unrealistic backtest results, and poor live trading performance.
What Does Indicator Repainting Mean?
Indicator repainting occurs when an indicator modifies past output after the bar has already formed. This can include changing historical values, moving signals to earlier bars, removing failed signals, or redrawing lines and zones based on future price action.
A signal is only reliable for live trading if it existed at the time the trade decision was made. If the signal appears only after future bars confirm it, the indicator may be useful for analysis but risky for backtesting or automated execution.
Why Detecting Repainting Matters
Repainting can create a major difference between what a trader sees on a historical chart and what actually happened in real time.
If repainting is not detected, it can lead to:
- Unrealistic backtest performance
- Look-ahead bias
- False confidence in strategy accuracy
- Signals that disappear in live trading
- Entries that were impossible to take in real time
- Incorrect automated trading logic
- Misleading alerts and scanner results
For strategy development, detecting repainting is not optional. It is a necessary step before trusting any indicator-based signal.
Common Signs That an Indicator May Repaint
1. Historical Signals Look Too Perfect
If an indicator consistently marks exact tops and bottoms, it may be using future confirmation. Perfect-looking reversal signals are often a warning sign.
For example, a sell signal that appears exactly at the highest candle of a swing may not have been available until several bars later. The indicator may be plotting the confirmed signal back on the earlier bar.
2. Signals Appear and Disappear in Real Time
One of the clearest signs of repainting is a signal that appears while the current candle is forming but disappears before or after the candle closes.
This often happens when an indicator calculates on the current unclosed bar. Since the candle’s high, low, close, and volume are still changing, the signal may also change.
3. Signal Locations Change After More Bars Form
Some indicators move signals from one bar to another as price action develops. This is common with ZigZag, pivot, swing, and fractal indicators.
If the signal position changes after additional bars appear, the indicator is repainting or using delayed confirmation.
4. Backtest Results Look Much Better Than Live Results
A strategy using a repainting indicator may show excellent historical results but perform poorly in real-time testing. This happens because the backtest may use signals that were not actually available during live trading.
If live signals do not match historical signals after reloading the chart, repainting should be investigated.
5. Higher-Timeframe Signals Change Before the Candle Closes
Multi-timeframe indicators can repaint when they use data from a higher timeframe before that higher-timeframe candle is closed.
For example, an indicator on a 5-minute chart may use a 1-hour trend filter. During the hour, the higher-timeframe value can change multiple times. A signal may appear during the hour and disappear before the hourly candle closes.
Practical Methods to Detect Repainting
1. Use Real-Time Observation
The simplest method is to watch the indicator in real time. When a signal appears, take a screenshot or record the chart. Later, compare the live signal with the historical chart after more bars have formed.
If the historical chart no longer matches what appeared in real time, the indicator may repaint.
2. Use Bar Replay or Market Replay
Bar replay is one of the best ways to test repainting behavior. It allows traders to replay historical data candle by candle and observe when signals actually appear.
During replay, check whether:
- The signal appears immediately or several bars later
- The signal moves to a previous bar after confirmation
- Failed signals disappear
- Indicator values change after the bar closes
If signals are different during replay compared with the fully loaded historical chart, repainting is likely.
3. Print Signal Values Bar by Bar
For developers, printing or logging signal values is one of the most reliable debugging methods.
Track the indicator output on every bar, including:
- Bar number
- Time
- Price
- Signal value
- Confirmation status
- Indicator calculation values
If a previous bar’s signal value changes after later bars are processed, the indicator is repainting.
4. Store Signal States Permanently
A useful test is to store each confirmed signal in a separate series or variable that does not change after the signal occurs.
For example:
0= no signal1= buy signal-1= sell signal
Once a signal is stored, it should remain fixed. If the original indicator output changes while the stored signal does not, the indicator may be recalculating past values.
5. Compare Historical Mode and Live Mode
Some indicators behave differently when loaded on historical data versus when running live. To detect this, compare:
- Historical chart signals
- Real-time signals
- Market replay signals
- Strategy backtest signals
- Alert history
If the same bar shows different signals depending on how the data is processed, the indicator’s logic may not be stable.
6. Check Whether the Indicator Uses Future Bars
Review the indicator logic if the source code is available. Repainting is likely if the code uses future information to confirm a current or past signal.
Warning signs include logic based on:
- Future candles
- Pivot confirmation bars
- Swing high or swing low confirmation
- ZigZag recalculation
- Centered moving averages
- Higher-timeframe candles before they close
- Redrawing support and resistance zones after confirmation
Using future data is not always wrong for visual analysis, but it should not be treated as a real-time trading signal.
7. Test Closed-Bar Logic
A reliable trading signal should usually be tested after the bar closes. If the indicator only gives stable signals when using closed-bar logic, then intrabar signals may be temporary.
To reduce false signals, compare:
- Signals calculated on every tick
- Signals calculated on bar close
- Signals confirmed after a specific number of bars
If signals disappear before the candle closes, they should not be used as confirmed strategy entries.
Repainting vs. Confirmation Delay
It is important to understand the difference between repainting and confirmation delay.
A confirmation delay means the indicator waits for additional bars before confirming a signal. This can be acceptable if the signal is used only after confirmation.
The problem occurs when the confirmed signal is plotted back on the original bar, making it look like the trader could have acted earlier.
For accurate backtesting, the actionable signal should be placed on the confirmation bar, not the original pattern bar.
Indicators That Commonly Need Repainting Checks
Some types of indicators should always be tested for repainting behavior before being used in a strategy.
Common examples include:
- ZigZag indicators
- Pivot high and pivot low indicators
- Swing point indicators
- Fractal indicators
- Divergence indicators
- Multi-timeframe indicators
- Support and resistance zone indicators
- Reversal signal indicators
- Centered or displaced moving averages
- Pattern recognition indicators
These tools can still be useful, but traders must understand when the signal becomes available.
Best Practices to Avoid Repainting Problems
To reduce repainting risk, traders and developers should follow several best practices:
- Use confirmed signals only
- Trigger trades on the confirmation bar
- Avoid future-bar references in strategy logic
- Use closed-bar calculations for entries and exits
- Separate temporary signals from confirmed signals
- Store confirmed signals so they do not change
- Test indicators with market replay
- Compare historical and live behavior
- Be careful with multi-timeframe signals
- Do not assume historical signals were available in real time
The most important rule is simple: if a signal was not visible at the time of decision, it should not be used as a valid historical trade signal.
Conclusion
Detecting repainting behavior in an indicator is essential for reliable trading analysis, backtesting, and automated strategy development. Repainting can make historical charts look more accurate than they were in real time, creating unrealistic expectations and unreliable strategy results.
The best way to detect repainting is to observe the indicator in real time, use bar replay, print signal values bar by bar, compare historical and live behavior, and check whether the indicator uses future data.
A reliable indicator should clearly distinguish between temporary signals, confirmed signals, and signals that are plotted historically after confirmation. By detecting repainting early, traders can avoid misleading backtests and build more realistic trading systems.
Tags
ing indicator, detect repainting, non-repainting indicator, indicator debugging, bar by bar testing, trading signals, backtesting reliability, look-ahead bias, ZigZag repainting, pivot indicator, swing high low, multi-timeframe indicator, market replay, trading strategy development, algorithmic trading, automated trading, technical analysis