This professional-grade technical analysis delivers an institutional-grade evaluation of the EURUSD currency pair utilizing an advanced quantitative setup on the cTrader platform. By deploying a 10-pip Renko chart, this analysis filters out transient market noise to isolate highly actionable trend continuations and structural reversals through the lens of the DMI Double Divergence framework.
Key Takeaways
- Tactical Bearish Continuation: The short-range horizon establishes strong hidden bearish divergence patterns, validating institutional order flow continuation to the downside.
- Mid-Range Distribution Capping: Regular bearish divergence structures at key overhead swing points confirm momentum exhaustion and structural distribution.
- Macro Trend Capitulation: A multi-week, long-range regular bullish divergence structure isolates seller exhaustion, indicating a high-probability cyclical reversal phase.
DMI Divergence Analysis: Multi-Horizon Structural Deep Dive
Chart 1: Short-Range Tactical Execution
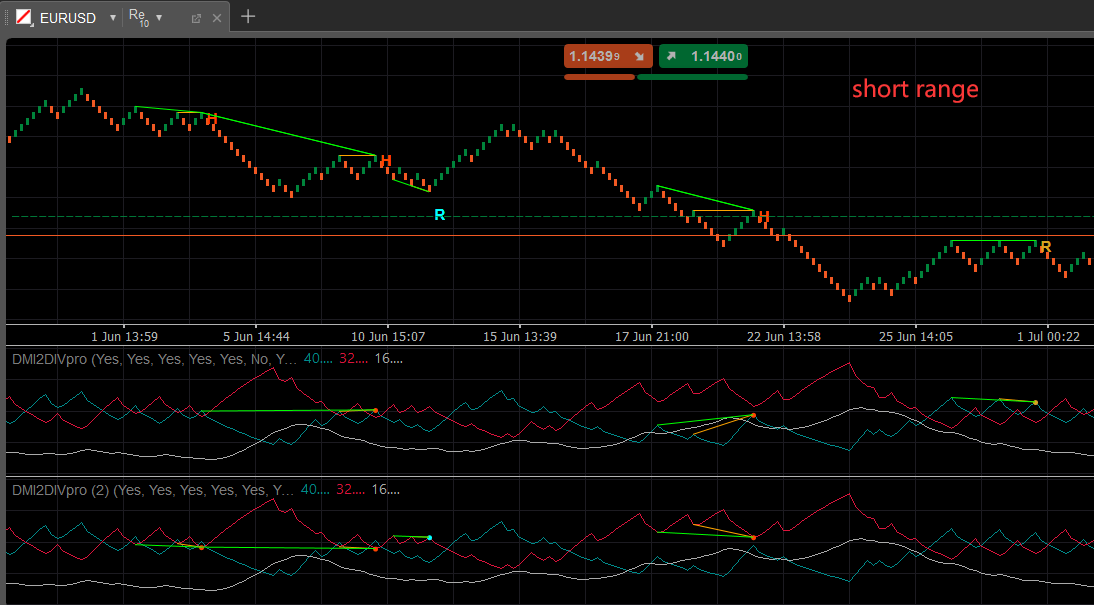
As observed on the cTrader chart demonstrating the short-range horizon, the EURUSD 10-pip Renko chart exposes an active markdown phase punctuated by highly precise counter-trend retests. The dual-panel DMI indicator framework maps a sequence of both Hidden (H) and Regular (R) divergence signals against key horizontal inflection zones.
When the asset attempts to rally back into localized minor resistance near 1.14400, the price action forms distinct lower structural swing highs. Concurrently, the underlying DMI momentum lines register higher relative peaks. This tactical mismatch defines a classic hidden bearish divergence, indicating that the buyers’ counter-trend momentum is structurally hollow and failing to match the underlying price action. The completion of a bearish Renko brick following this indicator signal provides immediate execution confirmation, validating the resumption of the primary institutional trend lower.
Chart 2: Mid-Range Distribution Context
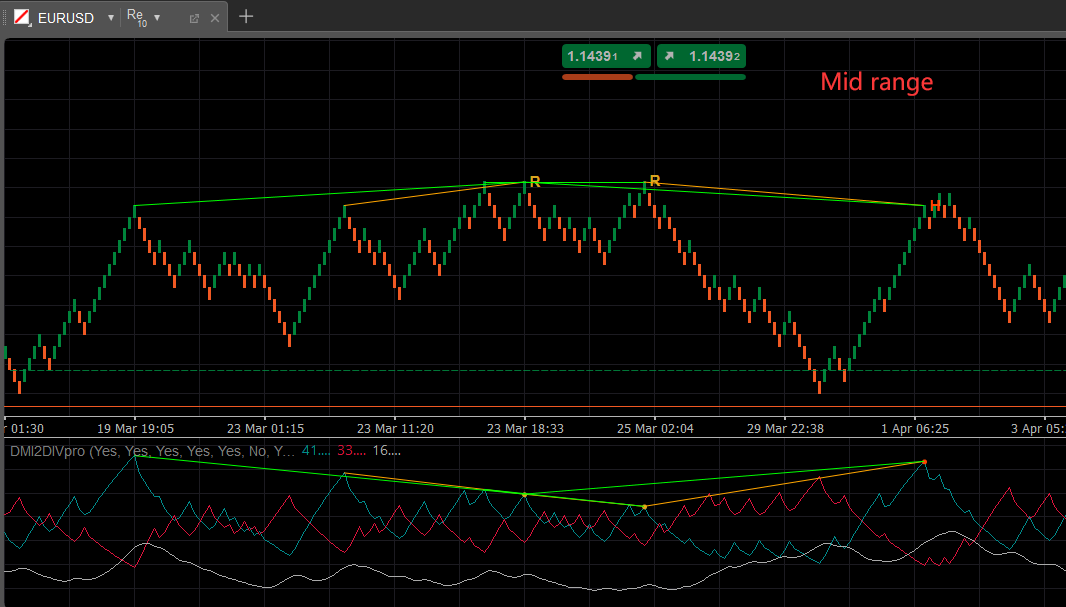
As observed on the cTrader chart capturing the mid-range structural perspective, the market transitions into a protracted distribution phase. The price action builds out a clean distribution ceiling, printing sequential equal or slightly varied peaks labeled with Regular (R) divergence markers.
While the price aggressively tests overhead liquidity pools to trigger retail breakout stops, the underlying DMI indicator displays prominent structural decay. The positive directional indicators print significantly lower momentum peaks relative to the prior price swing highs. This regular bearish double divergence underscores an institutional withdrawal of buying velocity. The failure of momentum to validate the price action at these highs confirms a heavy supply overhang, setting up a high-probability cyclical rotation back toward intermediate demand zones.
Chart 3: Long-Range Structural Reversal
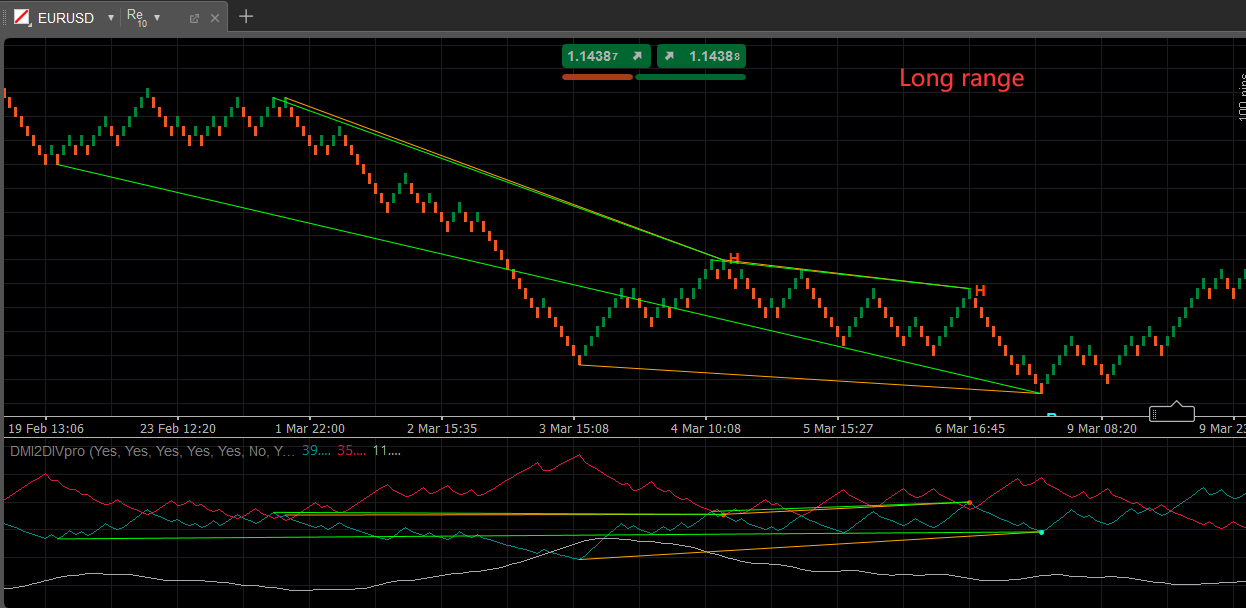
As observed on the cTrader chart outlining the long-range macro view, the pair exhibits terminal price action within a highly structured, multi-week descending channel. The price action prints consecutive lower lows along the falling channel support line, depicting an aggressive, extended bear market.
However, the long-range indicator panels capture a profound structural shift. While price drives to absolute cycle lows, the DMI components print clearly defined, ascending structural lows. This deep regular bullish divergence outlines an extensive accumulation profile and seller capitulation. The massive momentum divergence indicates that aggressive selling pressure has dried up at these depths. The printing of a clean bullish Renko brick above the immediate counter-trend trendline confirms that institutional accumulation has concluded, opening the door for a powerful macro trend reversal.
Trading Setup & Risk Management
Executing the DMI Double Divergence trading strategy requires strict adherence to structural rule sets and strict risk parameters.
Tactical Entry Triggers
- Short Continuations/Distribution: Short execution triggers immediately upon the closure of the first bearish (orange) Renko brick following a confirmed bearish crossover on the DMI indicator at localized resistance or distribution caps.
- Long Reversals: Long execution triggers upon a clean breakout above the descending structural counter-trend line, synchronized with a bullish (green) Renko brick confirmation following a macro regular bullish divergence signal.
Stop-Loss & Invalidation Levels
- Short Setups: The invalidation level is placed strictly above the structural swing high or the distribution ceiling plus a structural buffer to absorb standard liquidity sweeps.
- Long Setups: The stop-loss is established explicitly beneath the absolute terminal swing low printed during the macro accumulation phase. Any print below this level invalidates the structural reversal thesis.
Take-Profit & Target Objectives
- Downside Targets: Short positions scale out at major historical Renko swing lows, trailing remaining volume down to major institutional liquidity pools.
- Upside Targets: Long positions target the structural supply zones established during the mid-range distribution phases, specifically aiming for major liquidity pockets located near the upper distribution boundaries.
This manual details the configurable control variables for the MoneyFlow Double Divergence Pro institutional-grade multi-layered divergence indicator. Please visit Technical Inputs Manual: Double Double Pro for more details.
To fully harness the mathematical logic behind this system, it is crucial to understand the foundational concept of nested momentum decay. For a comprehensive architectural breakdown of how our dual-filtering framework handles consecutive market waves, explore our master guide on the Double Divergence Indicator Series.
The DMI Double Divergence Pro indicator is available in these platforms: Ctrader, MetaTrader(MT4, MT5), NinjaTrader 8, MultiCharts, MultiCharts x.NET, Tradingview(subchart only), Prorealtime(subchart only), SierraChart.