Comprehensive Technical Analysis of the Micro Nasdaq (MNQ) futures contract using the proprietary Money Flow Oscillator 2 Div Pro on the NinjaTrader 8 platform reveals an intricate Double Divergence matrix. By mapping order flow anomalies across short, mid, and long lookback windows on a 4 Renko chart, this analysis identifies critical structural inflection points where institutional selling momentum has reached terminal exhaustion.
Key Takeaways
- Multi-Range Bullish Confluence: The simultaneous printing of Regular Bullish Divergences (R) across short, mid, and long ranges confirms extensive seller exhaustion and strong institutional absorption at swing lows.
- Renko Noise Elimination: Utilizing a specialized 4 Renko chart configuration on NinjaTrader 8 filters out temporal volatility, isolating pure momentum shifts and highlighting high-probability execution zones.
- Asymmetric Risk Framework: The validation of clear structural support beneath the terminal divergence lows presents a highly defined invalidation level for an institutional long Trading Strategy.
Multi-Chart Deep Dive
Chart 1: Short Range Momentum Shift
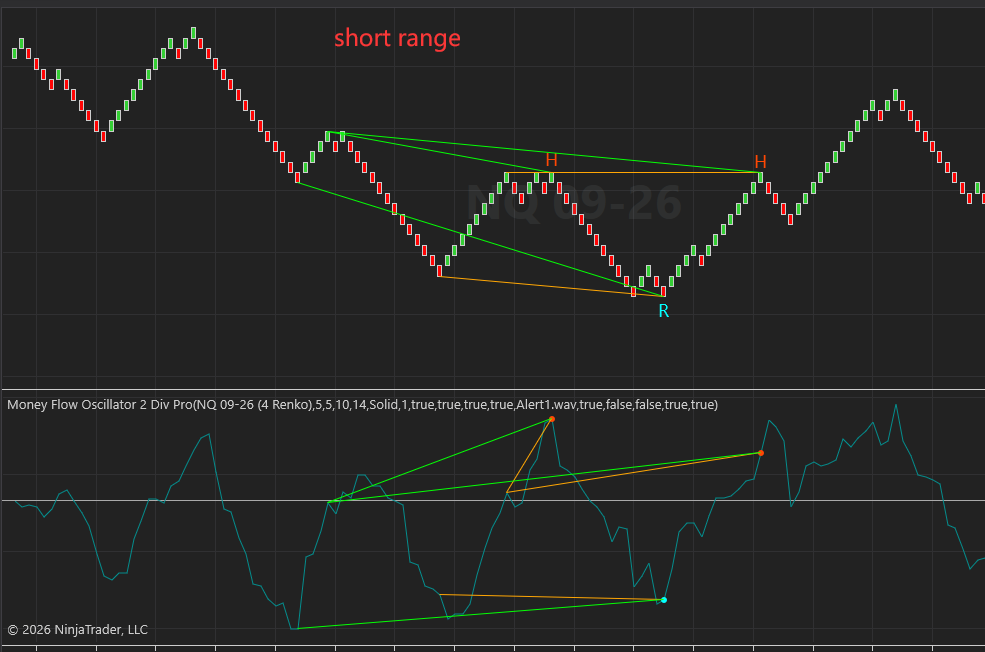
As observed on the NinjaTrader 8 chart in the chart, the localized market structure displays a textbook transition from a aggressive markdown phase into a compressed accumulation zone.
The Money Flow Oscillator 2 Div Pro prints a prominent Regular Bullish Divergence (R) at the absolute terminal low of this short-range window. While the underlying price action cuts lower to establish a micro lower low, the oscillator prints a distinct higher low. This structural mismatch indicates a severe deceleration in selling velocity.
Concurrently, a secondary Hidden Bearish Divergence (H) tracks a lower high in price against a higher high in the oscillator. This dynamic creates a temporary volatility squeeze, setting the stage for an explosive upward expansion as trailing short positions are forced to cover.
Chart 2: Mid Range Accumulation and Deceleration
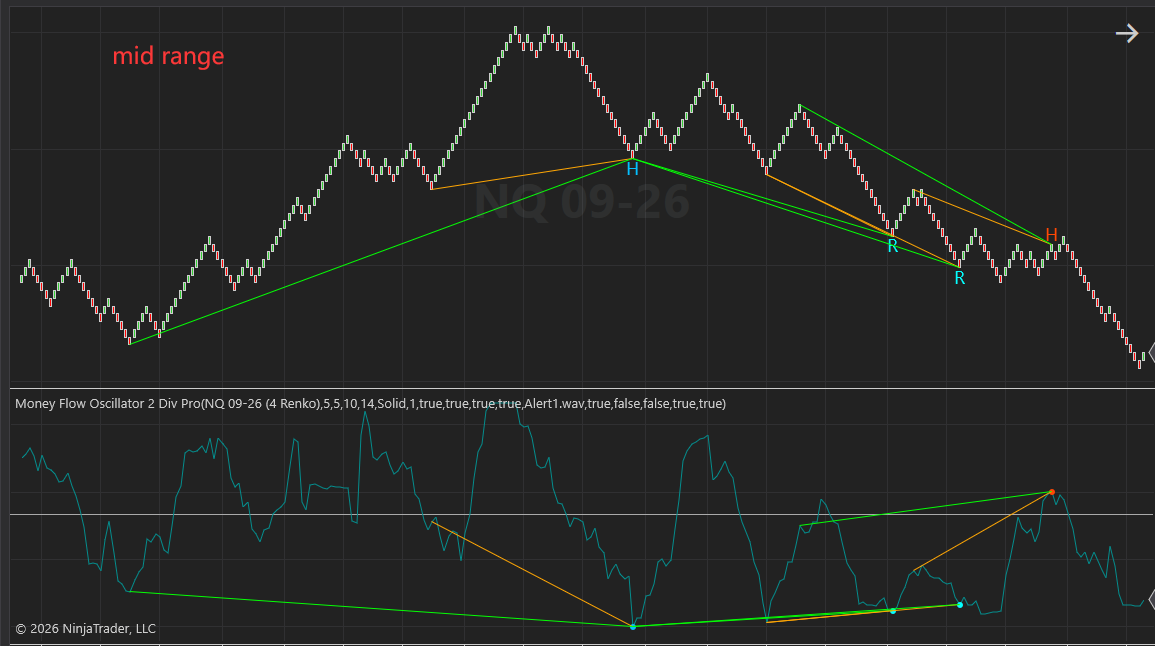
In the chart, the mid-range architecture captures the broader context of the descent. Following a macro expansion peak, the asset underwent a highly technical, stepped markdown phase.
As observed on the NinjaTrader 8 chart, the oscillator prints a succession of Regular Bullish Divergences (R) along the lower bounds of the descending channel. Despite the 4 Renko chart printing successive lower structural lows, the oscillator continuously forms higher baselines.
This multi-layered divergence indicates a systemic loss of bearish momentum. Each consecutive attempt by short sellers to drive the price lower is met with increasing passive buy liquidity, solidifying a robust institutional accumulation floor.
Chart 3: Long Range Structural Floor
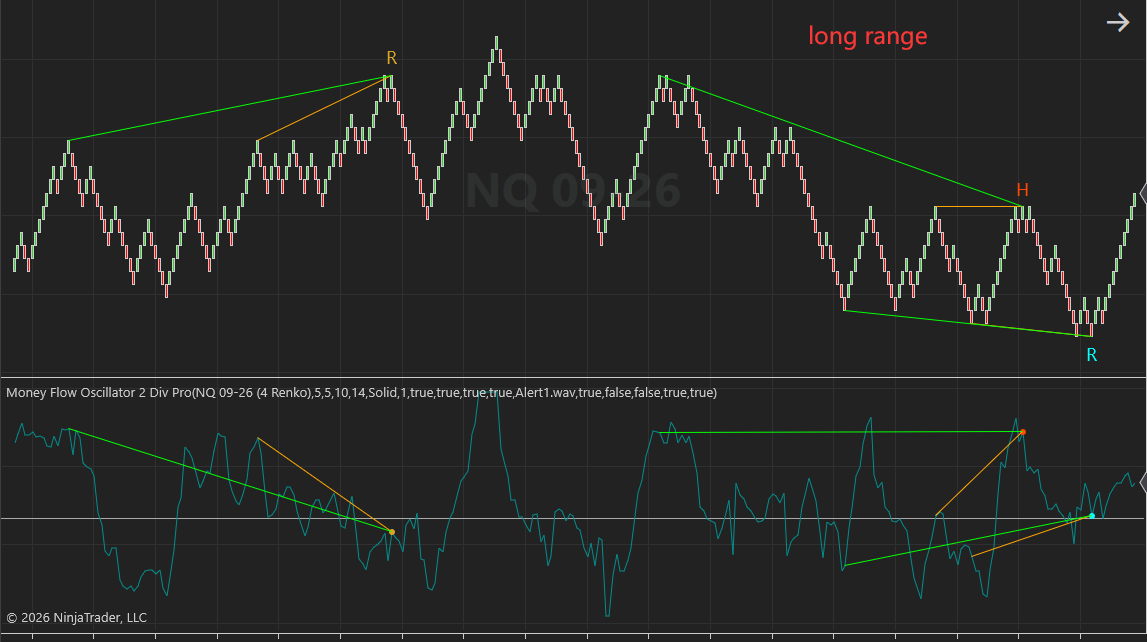
The macro-scale perspective is illustrated in the chart, outlining the comprehensive structural cycle of the Micro Nasdaq (MNQ) contract.
Early distribution at the absolute session highs was explicitly flagged by a macro Regular Bearish Divergence (R), which efficiently front-ran the subsequent trend reversal. Following the complete unwinding of that bullish cycle, the price dropped into a major demand pocket where a crucial long-range Regular Bullish Divergence (R) has formed.
As observed on the NinjaTrader 8 chart, the oscillator has maintained a structurally superior position relative to its historical oversold thresholds, even as price retested nominal lows. This macro divergence signals a complete exhaustion of the dominant bearish trend, shifting the higher-timeframe bias strictly toward the buy side.
Trading Setup & Risk Management
The confluence of multi-range divergence signatures across chart 1, chart (2) chart (3)
                  [Macro Bullish Targets] Target 2: Major Supply Zone
                                         ▲
                                         │
                  [Mid-Range Targets]    Target 1: Hidden Bearish Pivot
                                         ▲
                                         │
TRIGGER ZONE ──► 🟩 Confirming Green Renko Brick Breakout
                                         │
                                         ▼
STOP LOSS    ──► 🟥 Invalid level below Terminal Regular Bullish Low (R)
Execution Parameters
- Long Entry Trigger: Positions can be initiated upon a definitive bullish breakout above the immediate Hidden Bearish (H) pivot high identified in the short-range chart
(1). Confirmation requires at least one green reversal brick to close on the 4 Renko chart, validating a shift in immediate order flow. - Invalidation / Stop-Loss: The definitive line in the sand is located immediately beneath the lowest printed Renko brick at the terminal Regular Bullish Divergence (R) low across the mid-to-long range layouts. A breach of this level invalidates the entire accumulation thesis.
- Upside Targets:
- Target 1: Placed at the mid-range structural lower high, aligning with the major pivot point highlighted in
chart2. - Target 2: Mapped to the macro distribution supply zone near the origin of the initial markdown trend displayed in
chart3.
- Target 1: Placed at the mid-range structural lower high, aligning with the major pivot point highlighted in
This manual details the configurable control variables for the MoneyFlow Double Divergence Pro institutional-grade multi-layered divergence indicator. Please visit Technical Inputs Manual: Double Double Pro for more details.
To fully harness the mathematical logic behind this system, it is crucial to understand the foundational concept of nested momentum decay. For a comprehensive architectural breakdown of how our dual-filtering framework handles consecutive market waves, explore our master guide on the Double Divergence Indicator Series.
The MoneyFlow Double Divergence Pro indicator is available in these platforms: Ctrader, MetaTrader(MT4, MT5), NinjaTrader 8, MultiCharts, MultiCharts x.NET, Tradingview(subchart only), Prorealtime(subchart only), SierraChart.