This technical analysis evaluates the structural order flow and momentum dynamics of XAUUSD utilizing advanced multi-timeframe Renko scaling. By isolating price action from arbitrary time constraints, this analysis delivers institutional-grade clarity on the prevailing supply-and-demand matrix.
A sophisticated Double Divergence configuration has been detected and verified across multiple range perspectives using the proprietary ADX2DIVpro tracking engine on the cTrader platform. The multi-range alignment establishes a highly confluent directional bias, offering actionable execution parameters for systematic macro positioning.
Key Takeaways
- Dominant Macro Bearish Bias: The long-range structural framework exhibits systemic institutional distribution, characterized by sequential lower highs and validated momentum exhaustion.
- Mid-Range Structural Confluence: A freshly printed Hidden Bearish Divergence at the medium-term structural high confirms that the recent corrective upside has exhausted its order flow capacity.
- Short-Term Counter-Trend Friction: A localized Hidden Bullish Divergence on the short-range chart is generating a temporary tactical bounce, driving price into a high-premium overhead supply zone ideal for short-side execution.
Multi-Chart Deep Dive
To properly calibrate this Trading Strategy, the asset must be analyzed sequentially across three distinct range granularities to separate macro direction from execution-level noise.
1. Macro Context (Long Range)
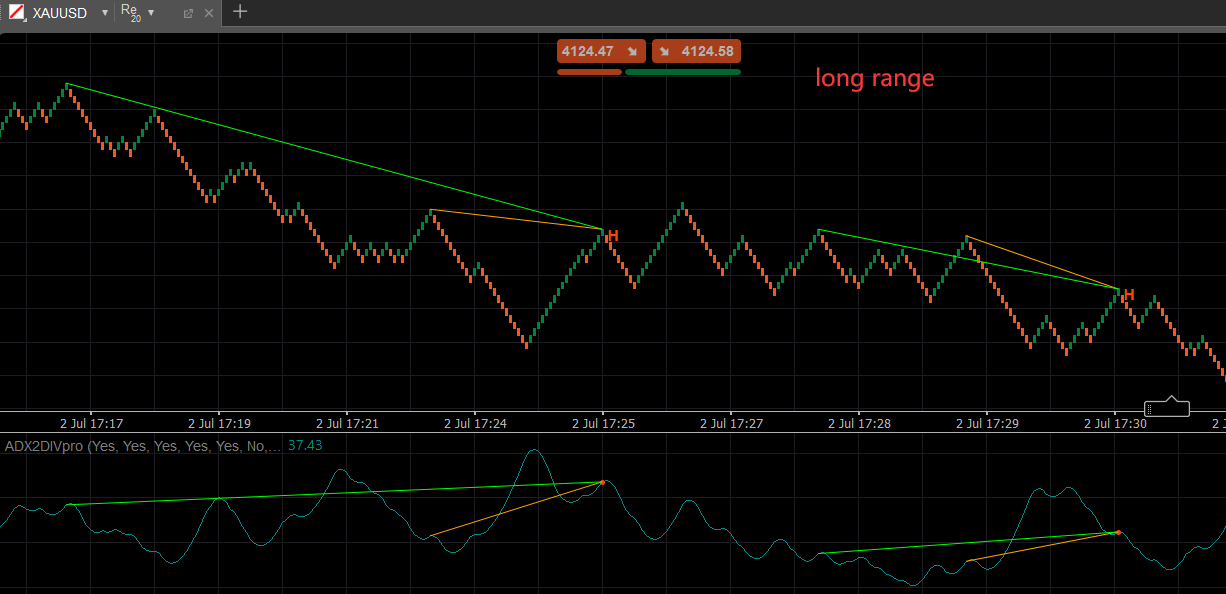
As observed on the cTrader chart, the high-level macro structural environment for XAUUSD is firmly locked in a structural markdown phase.
The Renko 20 brick structure filters out transient market noise, exposing a clean sequence of lower highs and lower lows. The ADX2DIVpro indicator across this long-range horizon highlights repeated Hidden Bearish Divergences (labeled ‘H’). Each sequential corrective rally in price fails to breach the previous structural peak, while the underlying momentum oscillator prints higher peaks. This signature confirms systematic institutional short-selling during periods of temporary counter-trend liquidity.
2. Structural Exhaustion (Mid Range)
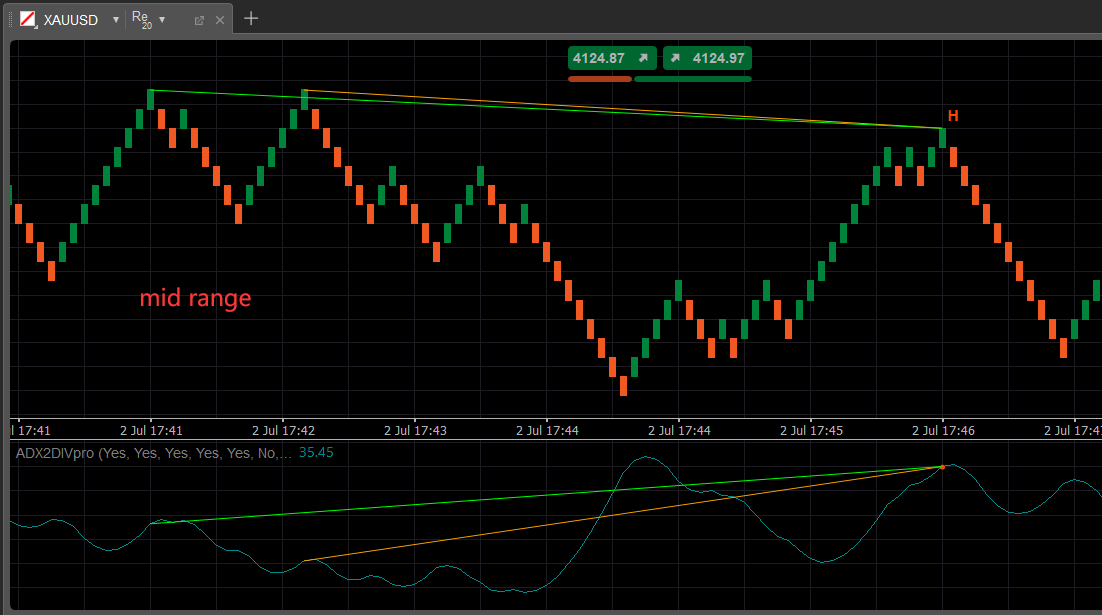
Zooming into the mid-range perspective via the chart, we can isolate the intermediate order flow dynamics governing the most recent swing segments.
As observed on the cTrader chart, the price action staged a significant multi-brick recovery from its local swing lows. However, as the price approached the previous major swing high, it printed a clear structural lower high. Concurrently, the ADX2DIVpro oscillator surged past its corresponding historical peak, registering a prominent intermediate Hidden Bearish Divergence (H).
With the live ask price hovering near 4124.97, this divergence signals that the buying volume driving the retracement has completely decoupled from price progression, indicating an imminent resumption of the primary macro markdown.
3. Tactical Execution Framework (Short Range)
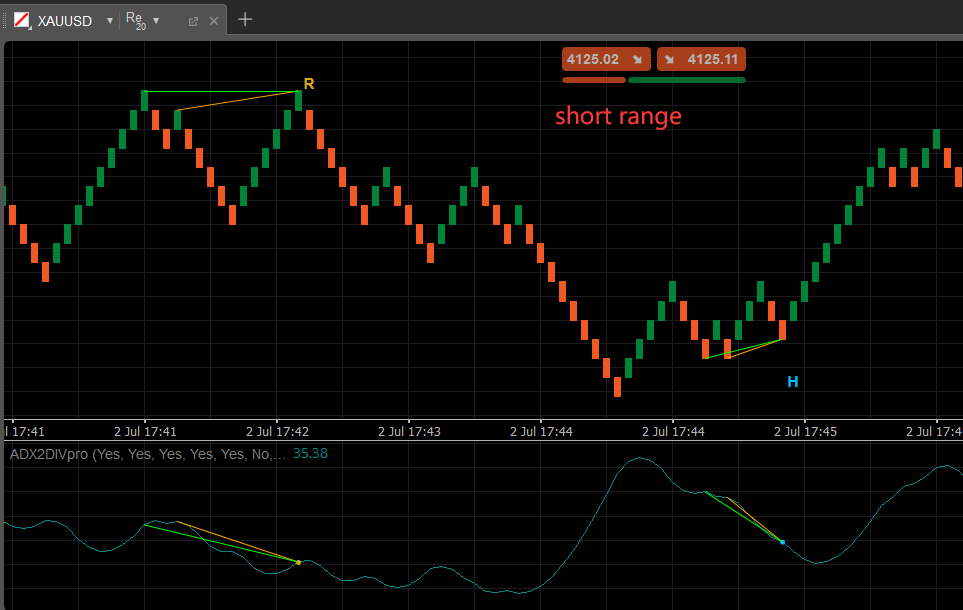
The immediate execution environment is captured in the short-range chart. This perspective reveals the micro-structural transitions occurring at key inflection points.
Initially, a Regular Bearish Divergence (R) materialized at the local double-top structure, accurately forecasting the aggressive down-swing that followed. However, following the completion of that bearish leg, the ADX2DIVpro engine flagged a tactical Hidden Bullish Divergence (H) at a micro-higher low, with the live bid printing at 4125.02.
This short-range bullish divergence explains the immediate localized upward momentum. Rather than signaling a true structural reversal, this minor bullish pop serves to deliver price into the premium supply zone validated by the mid- and long-range charts.
Trading Setup & Risk Management
The structural alignment across the three cTrader analysis windows establishes a high-probability asymmetric trading setup. The tactical short-term strength should be treated as an institutional liquidity hunt, offering optimal pricing for short-side deployment.
- Entry Trigger: Look for short execution upon short-range candlestick/brick confirmation inside the overhead supply cluster. This is signaled by a bearish reversal brick flipping the short-range momentum line back to negative, ideally between the 4125.00 and 4126.50 liquidity pool.
- Invalidation / Stop-Loss: The entire bearish thesis is structurally invalidated if price achieves a sustained breakout above the macro lower high printed on the mid-range chart. A protective stop-loss should be positioned safely above this structural pivot, strictly enforced at 4130.00.
- Downside Targets:
- Target 1 (Partial Take-Profit): 4118.00 (The immediate local swing low support visible on the short-range execution chart).
- Target 2 (Core Objective): 4105.00 (Macro extension targets derived from the long-range markdown structure).
This manual details the configurable control variables for the ADX Double Divergence Pro institutional-grade multi-layered divergence indicator. Please visit Technical Inputs Manual: Double Double Pro for more details.
To fully harness the mathematical logic behind this system, it is crucial to understand the foundational concept of nested momentum decay. For a comprehensive architectural breakdown of how our dual-filtering framework handles consecutive market waves, explore our master guide on the Double Divergence Indicator Series.
The ADX Double Divergence Pro indicator is available in these platforms: Ctrader, MetaTrader(MT4, MT5), NinjaTrader 8, MultiCharts, MultiCharts x.NET, Tradingview(subchart only), Prorealtime(subchart only), SierraChart.