Intraday technical structures on major currency pairs frequently require an analysis of momentum shifts across multiple lookback windows to filter out noise and isolate institutional order flow. This technical analysis provides an algorithmic deep dive into the EURUSD currency pair utilizing the 15min chart execution timeframe on the cTrader trading platform.
By employing a multi-range Double Divergence screening method via the proprietary Williams Percent Range indicator protocol, we isolate high-probability execution zones where structural price action and underlying momentum reach mathematical asymmetry.
Key Takeaways
- Multi-Range Structural Confluence: The overlapping presence of regular trend-reversal and hidden trend-continuation profiles across short, mid, and long lookback windows confirms highly defined institutional distribution and accumulation boundaries.
- Momentum Exhaustion Validation: Regular bullish setups print distinct failure-swing variations at macro structural floors, revealing severe seller exhaustion before rapid mean-reversion impulses occur.
- Actionable Continuation Confluence: Hidden divergence structures act as precise localized invalidation markers, allowing risk to be tightly managed against verified trend persistence zones.
Multi-Chart Deep Dive
Chart 1: Short-Range Tactical Execution Profile
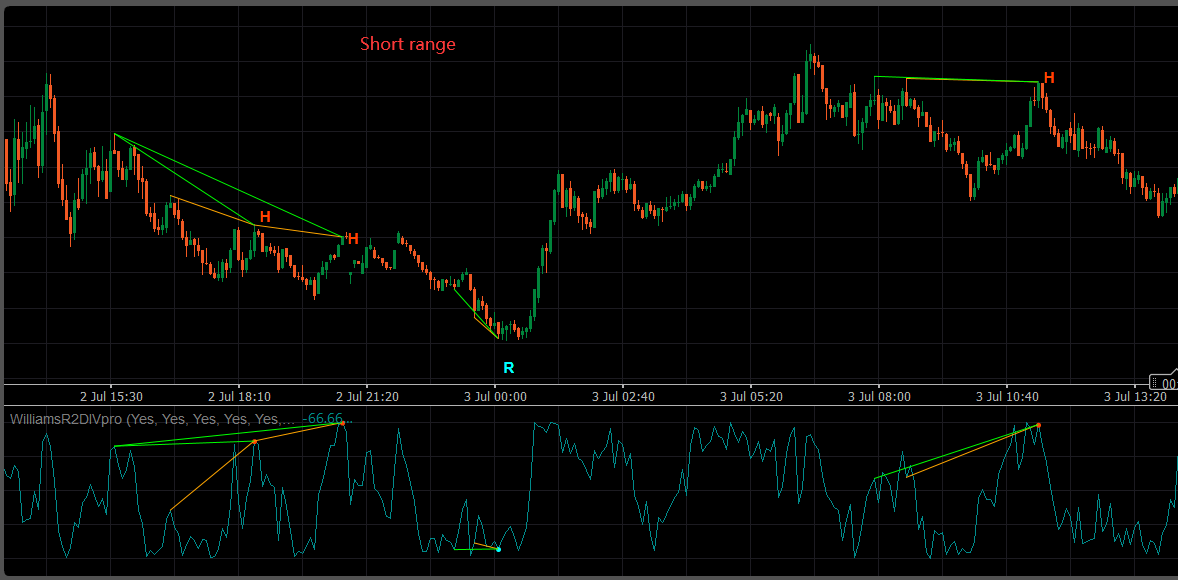
As observed on the cTrader chart focusing on short-range parameter settings, the 15min price action demonstrates exceptional structural fidelity to high-frequency momentum shifts. The system prints consecutive hidden bearish continuation lines along the descending phase of the local trend, capped by localized candle clusters. This sequence denotes a robust distribution zone where pullbacks are aggressively faded by dominant market participants.
Following this structural markdown phase, a pristine regular bullish divergence prints at the absolute cycle low (marked clearly by the indicator’s diagnostic R anchor point). While the price registers an isolated lower low, the oscillator tracking candle strength fails to replicate that weakness, printing a stark higher low. The immediate confirmation occurs via an engulfing candlestick setup, triggering a sharp trend-reversal impulse that cleanly violates the short-range counter-trend structures.
Chart 2: Mid-Range Structural Accumulation Context
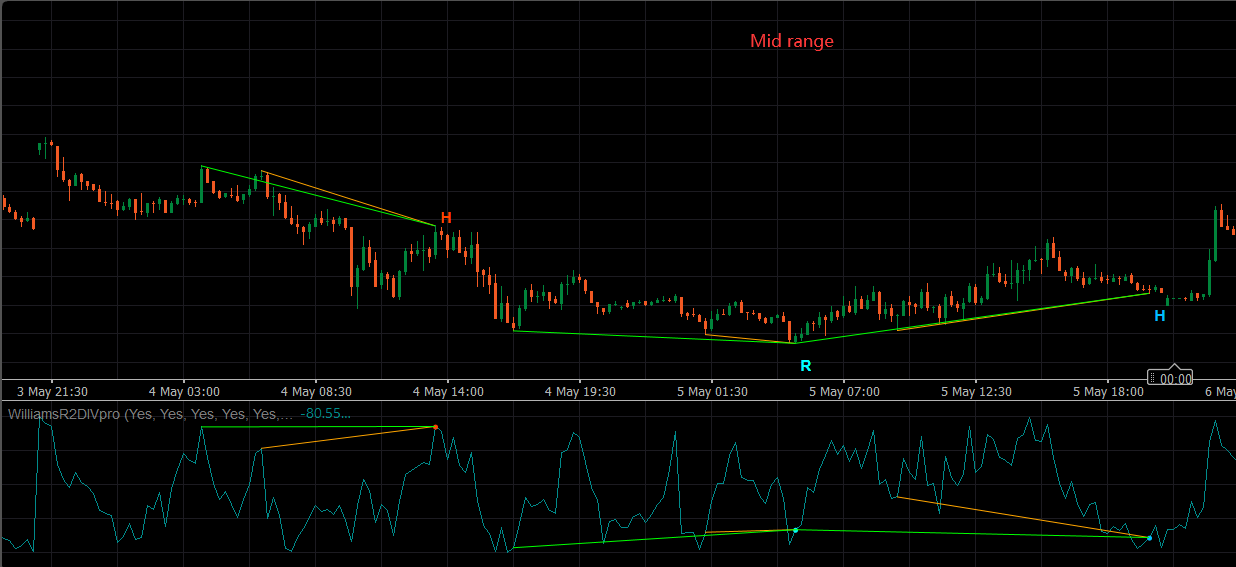
As observed on the cTrader chart configured for mid-range structural cycles, the technical layout shifts from rapid tactical turns to a broader macro-to-micro consolidation thesis. Over an extended multiple-session horizon, the asset maps out a wide base. The indicator prints a sweeping regular bullish divergence, bridging major swing lows across distinct trading sessions.
The validation of this mid-range Double Divergence indicator structure indicates systematic institutional accumulation along a major psychological support floor. Price action undergoes a prolonged deceleration phase, characterized by compressional candles and shortening of downward thrusts, while the oscillator demonstrates aggressive accumulation pressure. A subsequent hidden bullish trend continuation signal confirms that the newly initiated upward trajectory has captured significant structural velocity, flipping previous resistance zones into hard operational support.
Chart 3: Long-Range Macro Horizon & Trend Limits
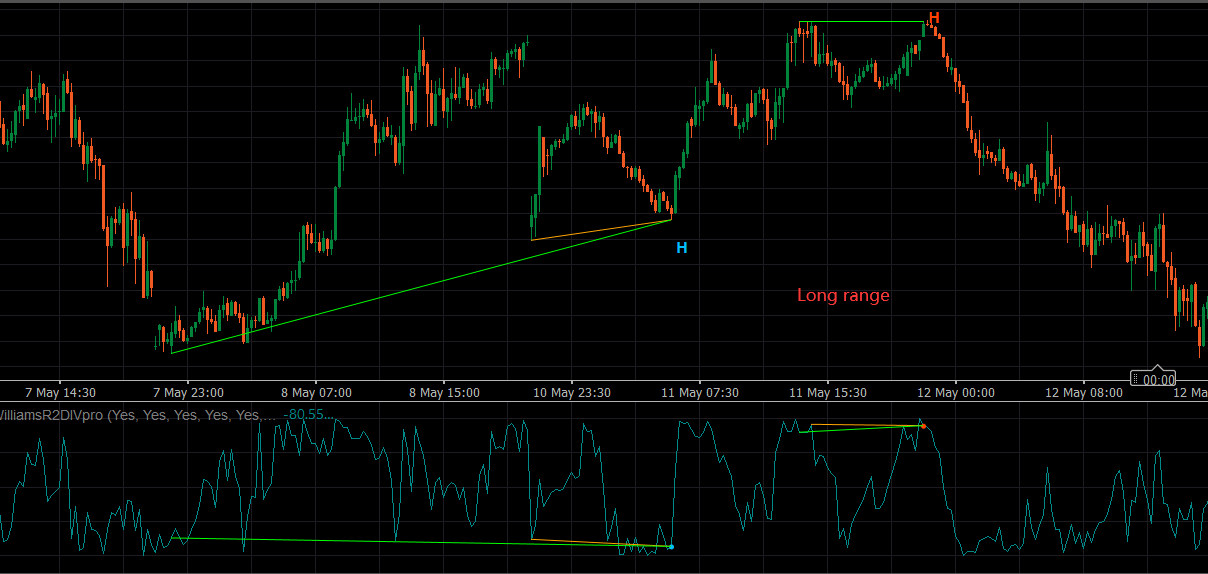
As observed on the cTrader chart capturing long-range technical parameters, the broader macro regime governing the 15min timeframe reveals deep structural trend limits. The primary feature of this macro window is an expansive multi-day hidden bullish divergence line. Despite a steep technical pullback from local highs, the primary swing low remains decisively higher than the historical structural base, while the underlying oscillator registers a complete reset into extreme oversold depths.
This structural divergence setup provides institutional confirmation of an overall bullish trend regime. The vast space between the indicator lows and price lows confirms that the macro upward structure remains intact. Conversely, as the price extends toward the upper structural resistance bands, the printing of a long-range hidden bearish divergence serves as an authoritative warning that the local expansion wave is nearing structural exhaustion, signaling the onset of systematic profit-taking and marking an explicit cap on further near-term upside.
Trading Setup & Risk Management
Implementing an institutional trading strategy around these multi-range setups requires strict execution filters and explicit risk parameters:
- Long Entry Trigger: Long exposure is validated upon the confluence of a mid-range regular bullish divergence and a short-range candlestick confirmation (e.g., a strong bullish expansion candle closing above the 8-period EMA).
- Short Entry Trigger: Short execution is triggered when a short-range or long-range hidden bearish divergence prints concurrently with a structural rejection pattern at a major horizontal resistance band.
- Stop-Loss Invalidation: For long positions, invalidation occurs strictly beneath the lowest price candle of the regular bullish divergence structure. For short positions, risk is capped directly above the localized high anchoring the hidden bearish divergence line.
- Take-Profit Targets: Primary upside targets are mapped using fixed Fibonacci extension levels (1.272 and 1.618) projected from the primary accumulation base, or at the immediate opposing structural high where long-range hidden bearish signals begin to cluster.
This manual details the configurable control variables for the MoneyFlow Double Divergence Pro institutional-grade multi-layered divergence indicator. Please visit Technical Inputs Manual: Double Double Pro for more details.
To fully harness the mathematical logic behind this system, it is crucial to understand the foundational concept of nested momentum decay. For a comprehensive architectural breakdown of how our dual-filtering framework handles consecutive market waves, explore our master guide on the Double Divergence Indicator Series.
The WilliamsR Double Divergence Pro indicator is available in these platforms: Ctrader, MetaTrader(MT4, MT5), NinjaTrader 8, MultiCharts, MultiCharts x.NET, Tradingview(subchart only), Prorealtime(subchart only), SierraChart.