Advanced Williams %R Divergence Analysis for MetaTrader 4
WilliamsR Double Divergence Pro for MT4 brings the PatternSmart Double Divergence methodology to MetaTrader 4, providing a structured way to analyze market extremes, relative price positioning, mean reversion, and potential reversal conditions.
Williams %R is particularly useful for evaluating where current price sits within its recent trading range. When price continues moving toward an extreme while Williams %R develops a different pattern, the divergence can provide additional information about the condition of the market.
Rather than treating divergence as an automatic trading signal, the Double Divergence methodology uses it as additional analytical evidence that should be evaluated alongside price action, market structure, support and resistance, and other forms of confirmation.
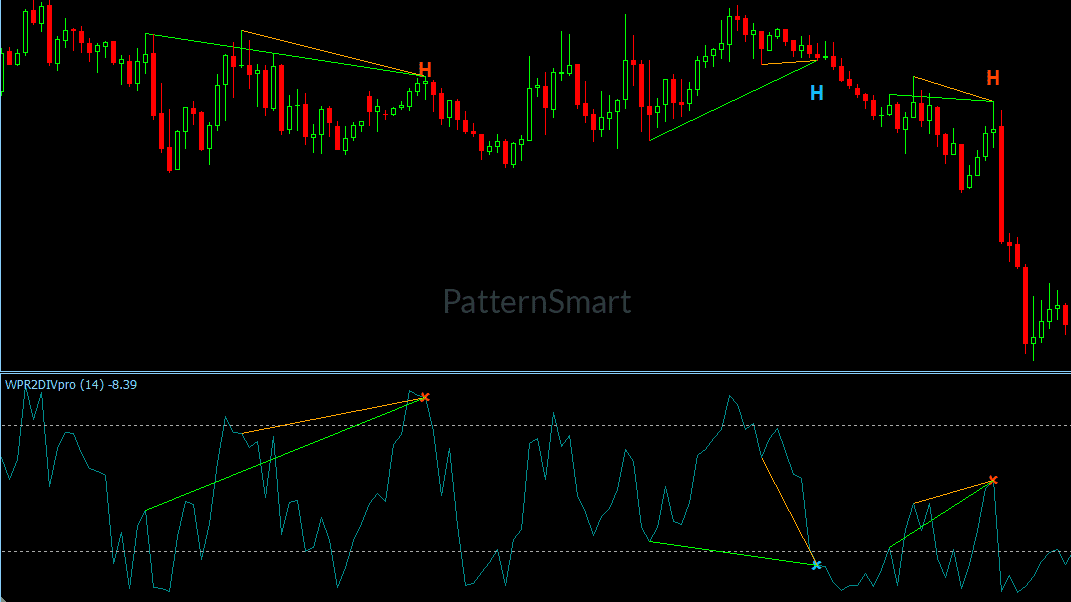
What Is Williams %R Double Divergence?
Williams %R is an oscillator that evaluates the position of current price relative to a recent trading range. This makes it particularly relevant when studying overextended price movement and market extremes.
The PatternSmart Double Divergence methodology adds a structured divergence perspective to this analysis.
Traditional divergence occurs when price and an indicator no longer move in agreement. For example:
- Regular Bullish Divergence: Price forms a lower low while the indicator forms a higher low.
- Regular Bearish Divergence: Price forms a higher high while the indicator forms a lower high.
- Hidden Bullish Divergence: Price forms a higher low while the indicator forms a lower low.
- Hidden Bearish Divergence: Price forms a lower high while the indicator forms a higher high.
Regular divergence is commonly associated with potential weakening of the current price movement, while Hidden Divergence can provide information about possible continuation within an established market structure.
The important distinction is that divergence represents information, not prediction. A divergence observation does not guarantee that price will reverse or continue. Its significance depends on the surrounding market context.
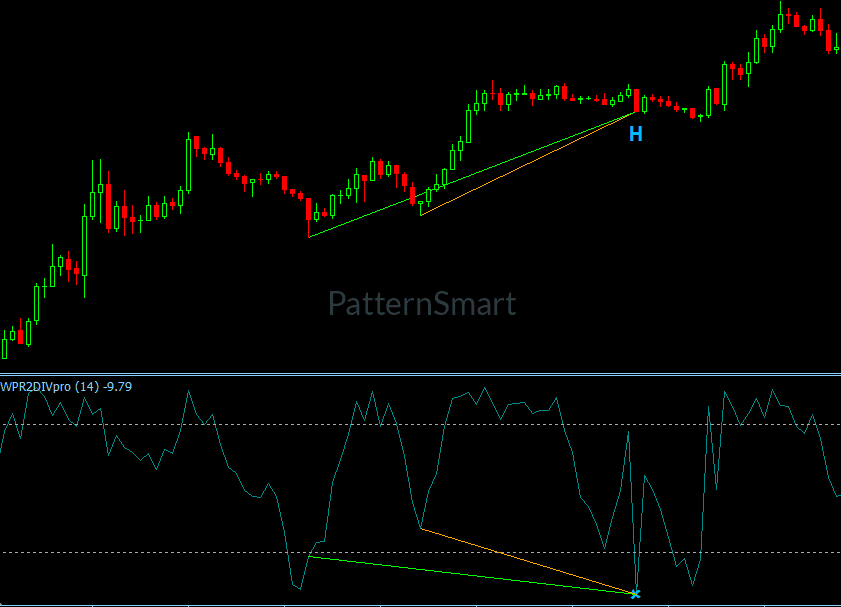
Why Williams %R Is Useful for Market Extreme Analysis
Markets frequently move beyond what traders might consider a normal short-term range before eventually changing direction or returning toward equilibrium.
Williams %R is designed to examine relative price positioning within a recent range, making it useful for studying these conditions.
Consider a market that has experienced a sustained upward move. Price continues to establish new highs, but the corresponding Williams %R behavior begins to show less support for that progression.
This difference does not mean that the market must reverse.
Instead, it creates an analytical question:
Is the latest price extreme receiving the same underlying support as earlier price movement?
That question is central to divergence analysis.
Williams %R Double Divergence helps organize this type of observation so traders can evaluate price extremes together with indicator behavior rather than examining either one independently.
Williams %R Double Divergence and Mean Reversion
Williams %R Double Divergence is particularly suited to mean-reversion analysis.
Mean reversion refers to the idea that extended price movement may eventually move back toward a more balanced area. However, markets do not automatically revert simply because an indicator reaches an extreme.
This is where context becomes important.
A Williams %R divergence may be more informative when considered alongside:
- Recent market structure
- Important support and resistance levels
- Price action
- The broader trend
- Volatility
- Higher-timeframe conditions
- Other independent technical evidence
The objective is not to predict exactly where price will turn. Instead, the objective is to recognize when price movement and relative positioning are providing different information.
This makes Williams %R Double Divergence particularly relevant for traders studying market extremes and potential reversal environments.
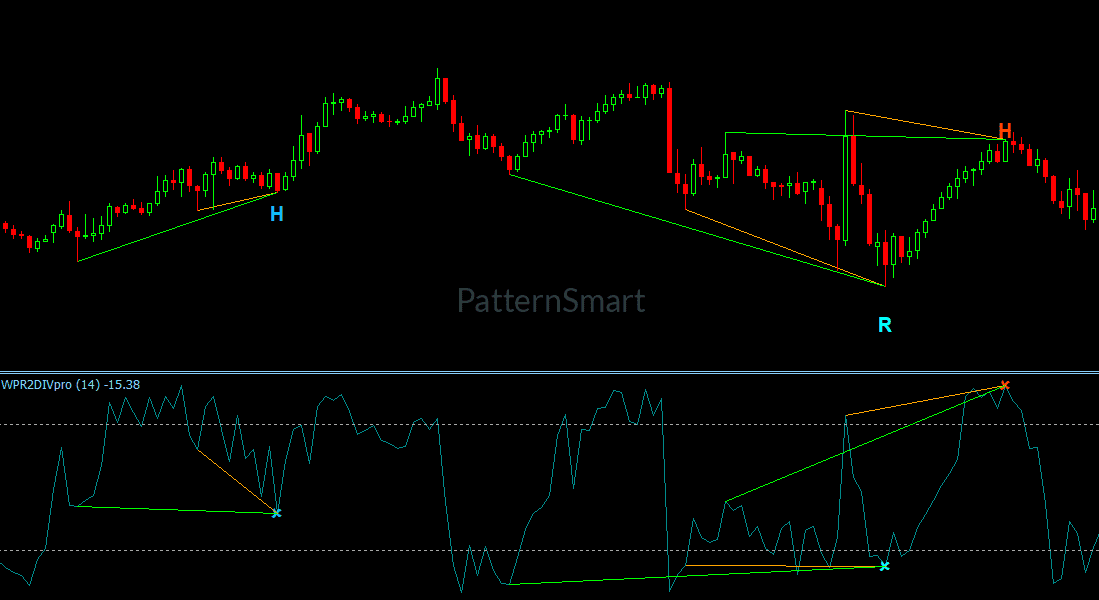
Four Types of Double Divergence
WilliamsR Double Divergence Pro supports the four core divergence categories used throughout the PatternSmart methodology.
Regular Bullish Divergence
Regular Bullish Divergence occurs when price establishes a lower low while Williams %R establishes a higher low.
This can indicate that the latest downward price movement is not being confirmed in the same way by the indicator.
It should be interpreted as evidence of a possible change in market conditions rather than as a guaranteed bullish reversal.
Regular Bearish Divergence
Regular Bearish Divergence occurs when price forms a higher high while Williams %R forms a lower high.
The disagreement may indicate that the latest upward price movement deserves closer examination.
Additional confirmation from price action and market structure remains important.
Hidden Bullish Divergence
Hidden Bullish Divergence occurs when price forms a higher low while Williams %R forms a lower low.
This type of divergence is commonly associated with continuation analysis following a pullback.
Because Williams %R is particularly relevant to relative price positioning, the signal can provide another perspective when evaluating whether a correction has altered the broader market structure.
Hidden Bearish Divergence
Hidden Bearish Divergence occurs when price forms a lower high while Williams %R forms a higher high.
It can contribute to analysis of potential bearish continuation following a temporary upward correction.
As with all Double Divergence observations, context and independent confirmation remain essential.
Double Divergence: More Than a Single Divergence Observation
A key principle of PatternSmart’s methodology is that Double Divergence should be understood as an analytical methodology rather than a standalone trading signal.
Technical analysis involves evaluating evidence under uncertain market conditions. Price remains the primary source of information, while an indicator provides another perspective.
The process can be viewed as:
Price Action → Divergence Observation → Context → Confirmation → Technical Interpretation
This approach helps prevent a common mistake in divergence analysis: assuming that every divergence automatically represents a reversal.
Instead, Williams %R Double Divergence provides additional information that can be incorporated into a broader analytical process.
Built for MetaTrader 4
MetaTrader 4 is an established trading environment widely used by Forex, CFD, and retail traders.
Its familiar charting workflow, broad broker support, customization capabilities, and extensive ecosystem make it well suited to practical day-to-day technical analysis.
WilliamsR Double Divergence Pro integrates naturally into this environment by adding structured divergence analysis without requiring traders to abandon their existing MT4 workflow.
Traders can combine the indicator with their normal chart analysis and other technical tools while maintaining the same Double Divergence methodology used across PatternSmart’s supported platforms.
Professional Features for a More Flexible MT4 Workflow
WilliamsR Double Divergence Pro includes configurable features designed to control signal generation, filtering, alerts, and chart presentation.
Four Selectable Divergence Types
The indicator provides separate controls for:
- Show Regular Bullish
- Show Regular Bearish
- Show Hidden Bullish
- Show Hidden Bearish
Each setting controls its corresponding divergence type, allowing traders to focus their chart analysis on the signals relevant to their analytical workflow.
Wait 1 Bar
Wait 1 Bar controls whether the indicator requires one completed confirmation bar before finalizing a detected Double Divergence signal.
When enabled, the indicator waits until the next bar has completely closed before confirming the signal. This can provide additional confirmation and reduce premature signal confirmation, although confirmation occurs slightly later.
Enhanced Mode
Enhanced Mode is a Signal Filtering feature that applies additional structural validation.
Rather than generating another type of signal, it is designed to refine potential signals through additional validation. This makes it a useful configuration option when the analytical objective places greater emphasis on structural filtering.
Divergence Lookback and Filter Length
Advanced parameters include:
- Divergence Lookback
- Filter Length
- Divergence Bar Range
These parameters belong to the indicator’s analytical engine and influence aspects such as swing-point identification, internal smoothing, and structural search boundaries. They should be viewed as configuration controls rather than independent trading strategies.
Alerts
Enable Alert allows notifications for confirmed signals, while Alert Sound controls the notification sound.
These settings are designed to support chart-monitoring workflows without changing the underlying divergence calculation.
Clean Chart Visualization
The indicator also provides visualization controls including:
- Show Char
- Show Line
- Only Show Last Signal Within Bars
- Price Line Brush
- Price Line Dash Style
- Price Line Width
These options allow traders to manage how divergence information is presented on the chart and help keep the analytical workspace organized. Display settings affect presentation rather than changing the underlying methodology.
Practical Applications of WilliamsR Double Divergence Pro
WilliamsR Double Divergence Pro is designed around several analytical applications.
Market Extreme Analysis
When price reaches an extended area of its recent range, Williams %R provides a relative-position perspective that can complement direct price analysis.
Reversal Analysis
Regular divergence can highlight situations where price continues making new extremes while the indicator behaves differently.
This can provide an early reason to examine whether the existing movement is losing support.
Mean-Reversion Analysis
Williams %R is particularly relevant when studying markets that move within ranges or experience extended price swings followed by normalization.
Counter-Trend Analysis
For traders who study counter-trend opportunities, divergence can provide an additional analytical perspective when price reaches significant extremes.
However, counter-trend analysis requires careful context because strong sustained trends can continue longer than expected. The Indicator Knowledge Base specifically identifies strong sustained trends as a limitation for Williams %R Double Divergence.
When Should Williams %R Divergence Be Confirmed?
A divergence should not be evaluated in isolation.
A more disciplined analytical process considers whether other technical evidence supports the same interpretation.
Potential confirmation sources include:
- Price action
- Market structure
- Support and resistance
- Higher-timeframe analysis
- Volatility characteristics
- Other complementary indicators
For example, a bearish Williams %R divergence near an important resistance area may deserve different analysis from the same divergence occurring in the middle of a powerful, sustained trend.
The divergence provides the observation.
Market context provides the meaning.
This confirmation-first approach is central to the PatternSmart Double Divergence methodology.
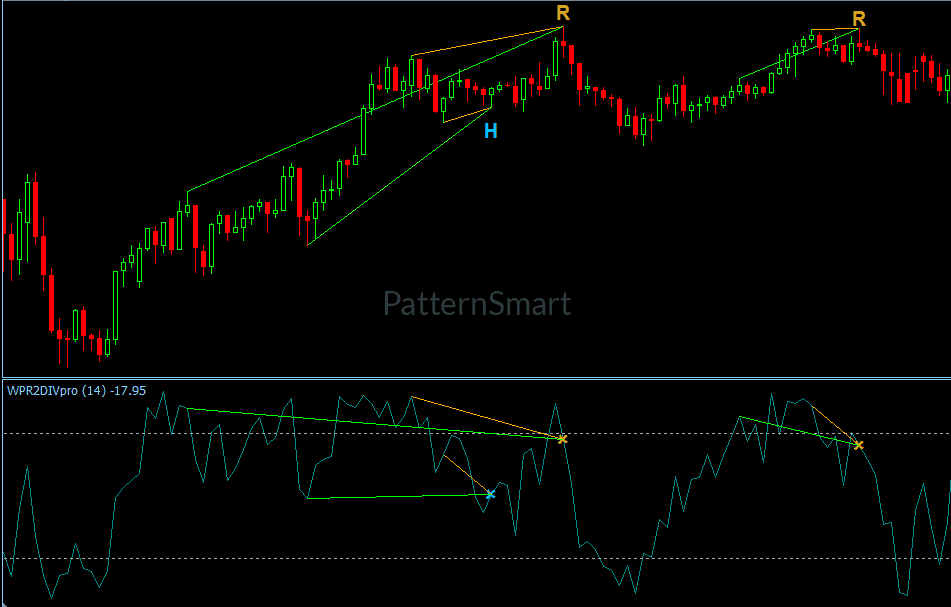
Why Choose WilliamsR Double Divergence Pro for MT4?
WilliamsR Double Divergence Pro is designed for traders who want to incorporate relative price positioning and market-extreme analysis into a familiar MetaTrader 4 environment.
Key analytical benefits include:
- Structured analysis of price extremes
- Four distinct Double Divergence categories
- Support for mean-reversion analysis
- Additional perspective on potential reversal conditions
- Flexible signal-generation controls
- Optional structural filtering
- Configurable alerts
- Customizable chart visualization
- Familiar MetaTrader 4 workflow
The purpose is not to replace price analysis or trader judgment. Instead, the indicator provides another source of technical evidence that can be incorporated into a broader analytical framework.
Who Is WilliamsR Double Divergence Pro for MT4 Designed For?
This product is particularly relevant to:
- Forex traders using MetaTrader 4
- CFD traders
- Swing traders
- Technical analysts
- Mean-reversion traders
- Traders studying market extremes
- Traders interested in divergence-based reversal analysis
- MT4 users seeking additional technical confirmation
Williams %R is not intended to replace other forms of analysis. Its particular value comes from the perspective it provides on relative price positioning and market extremes.
WilliamsR Double Divergence Pro for MT4: Frequently Asked Questions
What does WilliamsR Double Divergence Pro analyze?
It combines Williams %R with the PatternSmart Double Divergence methodology to analyze relative price positioning, market extremes, mean reversion, and potential reversal conditions.
Does Williams %R Double Divergence predict market reversals?
No. Divergence provides analytical information rather than a guaranteed prediction. Market context and confirmation remain important.
What is the difference between Regular and Hidden Divergence?
Regular Divergence is commonly associated with potential weakening of the existing price movement, while Hidden Divergence is commonly associated with continuation analysis.
Can I display only specific divergence types?
Yes. The indicator provides separate controls for Regular Bullish, Regular Bearish, Hidden Bullish, and Hidden Bearish divergence.
Does the indicator provide alerts?
Yes. Enable Alert and Alert Sound are available as configurable alert features.
Can the confirmation timing be adjusted?
Yes. Wait 1 Bar determines whether the indicator waits for one completed confirmation bar before finalizing a detected signal.
Is Williams %R Double Divergence suitable for every market condition?
No indicator is universally suited to every environment. The Williams %R profile is particularly aligned with range-bound markets, mean-reversion environments, swing trading, and counter-trend analysis. Strong sustained trends can present limitations, so broader market context remains important.
Does the indicator replace price action analysis?
No. PatternSmart’s methodology treats price as the primary source of information. The indicator is intended to provide additional analytical evidence rather than replace direct market analysis.
Conclusion
WilliamsR Double Divergence Pro for MT4 combines the relative price-positioning perspective of Williams %R with PatternSmart’s structured Double Divergence methodology.
Its primary analytical focus is on market extremes, relative positioning, mean reversion, and reversal potential. Rather than treating divergence as a mechanical entry signal, the methodology encourages traders to evaluate divergence as one part of a broader technical analysis process.
For MetaTrader 4 traders, this creates a practical way to incorporate structured Williams %R divergence analysis into an established charting workflow while maintaining the familiar MT4 environment.
The objective is straightforward: identify differences between price behavior and relative market positioning, then evaluate those differences within the broader market context.
Explore WilliamsR Double Divergence Pro for MT4
Add structured Williams %R Double Divergence analysis to your MetaTrader 4 technical analysis workflow and use it as an additional source of evidence when studying market extremes, mean reversion, and potential reversal conditions.
Analyze the divergence. Evaluate the context. Make the decision.
[Get Started With WilliamsR Double Divergence Pro for MT4]
Looking for the complete mathematical breakdown, step-by-step optimization guides, and advanced trading strategies? Explore our comprehensive documentation:
Visit the Technical Inputs Manual: Double Divergence Pro for full parameter tuning.
Read the master guide on the Double Divergence Indicator Series.