Eli Lilly and Company (LLY) Daily Chart Technical Analysis: Evaluating Price Structure and RSI Double Divergence Signals
Market Overview
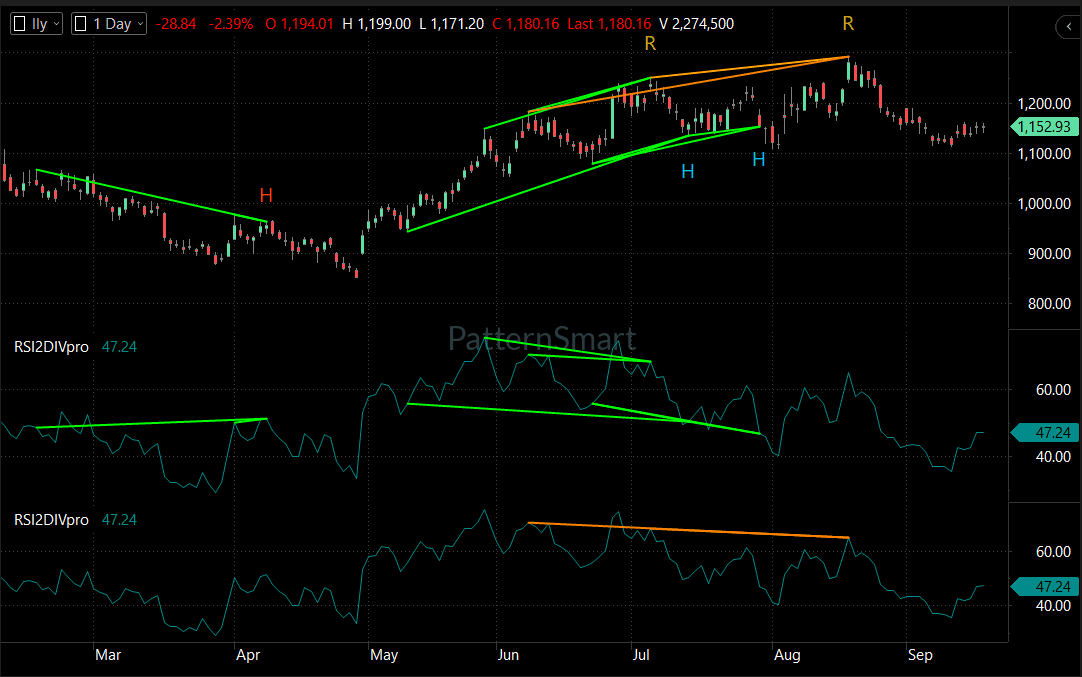
The daily candlestick chart for Eli Lilly and Company (LLY) demonstrates a dynamic multi-month market transition spanning from March through September. The chart reveals three distinct structural phases: an initial downtrend bottoming out in late April, a powerful bull regime that propelled price from below $900.00 to highs above $1,200.00 by mid-summer, and a recent high-level consolidation phase.
Throughout this price expansion, the stock exhibited multiple momentum-to-price interactions, including both trend continuation and trend exhaustion patterns. Analyzing the structural swing points alongside the momentum indicator provides valuable insight into the mechanics behind LLY’s sustained rally and subsequent pause.
Chart Setup
- Instrument: Eli Lilly and Company
- Symbol: LLY
- Timeframe: Daily (1 Day)
- Chart Type: Candlestick Price Chart
- Primary Indicator: RSI Double Divergence (
RSI2DIVpro, currently reading 47.24 across both indicator subpanels) - Last Visible Price: $1,180.16 (OHLC: Open $1,194.01, High $1,199.00, Low $1,171.20, Close $1,180.16)
Price Action Analysis
Price action on the LLY daily chart reflects clear shifts in supply and demand balance across the observation window:
- Downtrend and Base Formation (March–April): LLY experienced a persistent sell-off from March into April, characterized by a series of lower highs and lower lows, ultimately finding a major floor near $850.00 in late April.
- Impulsive Trend Expansion (May–June): Upon establishing a bottom, buyers surged into the stock, driving an aggressive, impulse rally. Price broke above intermediate resistance levels near $1,000.00 with strong green candles and minimal retracement depth.
- Ascending Consolidation & Climax Highs (June–August): From June through early August, the advance transformed into a steady upward channel. Although price continued to forge higher highs—eventually surpassing $1,250.00 in August—the slope of the advance flattened into a rising wedge structure, characterized by overlapping candles and heightened volatility.
- Recent Retracement and Range Stabilization (August–September): Following its peak above $1,250.00, LLY underwent a sharp sell-off back toward the $1,100.00 support area before stabilizing into a sideways consolidation range near $1,152.93–$1,180.16.
Trend Analysis
The macro and short-term trend structures display a transition from strong directional momentum to range-bound equilibrium:
- Primary Macro Trend: Structurally bullish. The series of higher highs and higher lows established from the April bottom ($850.00 region) through the August peak ($1,250.00+) maintains an intact longer-term uptrend frame.
- Intermediate Trend: Transitioned from a strong uptrend to neutral/consolidation. The failure to make new highs after the August peak, followed by a pullback to $1,100.00, indicates that the strong vertical trend phase has paused.
- Short-Term Trend: Neutral to slightly bullish recovery, with price bouncing off $1,100.00 support and holding above $1,150.00.
Key Support and Resistance Levels
Key horizontal and structural price boundaries visible on the chart include:
- Major Overhead Resistance ($1,250.00 – $1,270.00): The peak of the uptrend established in early August, where the Regular Bearish Double Divergence resolved into a sharp sell-off.
- Intermediate Resistance ($1,200.00): A round-number psychological level and local swing high boundary tested in late June, mid-July, and recent candle wicks.
- Intermediate / Pivot Support ($1,100.00 – $1,120.00): A crucial structural reaction floor where multiple pullbacks in June, July, and late August found aggressive buying defense.
- Major Structural Demand Support ($850.00 – $870.00): The macro baseline floor from late April that marks the origin of the primary bull market expansion.
Momentum Analysis
The lower indicator panels feature the RSI2DIVpro momentum oscillator, currently reading 47.24. Oscillator behavior reveals significant shifts across the timeframe:
- Oversold Expansion to Overbought Surges: RSI printed low readings near 30.00–40.00 during the April low, followed by a surge above 70.00 during the impulsive May expansion.
- Divergent Momentum Peaks: As price made higher highs from June through August, oscillator peaks grew progressively lower, signaling a loss of buying velocity despite higher price quotes.
- Current Equilibrium: The oscillator has returned to the 47.24 level, residing near its neutral midpoint (50.00), which aligns with the current sideways price consolidation.
Signal-by-Signal Double Divergence Analysis
The chart features several distinct Double Divergence signals highlighted by multi-point trendlines and letter markers (“H” for Hidden Bullish Double Divergence and “R” for Regular Bearish Double Divergence). Each signal is evaluated independently below.
                    ┌─────────────────────────────────────────┐
                    │       LLY DOUBLE DIVERGENCE SIGNALS     │
                    └────────────────────┬────────────────────┘
                                         │
         ┌───────────────────────────────┴───────────────────────────────┐
         ▼                                                               ▼
┌─────────────────────────────────┐                             ┌─────────────────────────────────┐
│ Hidden Bullish Signals ("H")    │                             │ Regular Bearish Signals ("R")   │
├─────────────────────────────────┤                             ├─────────────────────────────────┤
│ • Signal #1: March - April      │                             │ • Signal #4: June - July        │
│ • Signal #2: May - July         │                             │ • Signal #5: June - August      │
│ • Signal #3: June - August      │                             │                                 │
└─────────────────────────────────┘                             └─────────────────────────────────┘
Signal #1: Hidden Bullish Double Divergence (“H”) — March to April
- Divergence Type: Hidden Bullish Double Divergence (“H”).
- Expected Market Behavior: Potential trend continuation / bullish resumption after a pullback structure.
- Where It Appears: Across the descending price segment in late March to mid-April, highlighted by a green trendline on the price chart sloping downward across swing highs, and a corresponding green trendline on the RSI panel sloping upward.
- Price Movement: Price held lower highs during a corrective phase, maintaining a controlled decline without collapsing precipitously prior to the final low.
- Indicator Movement: The RSI indicator printed higher momentum peaks across the reference points, demonstrating building underlying buying pressure despite price lagging.
- Context & Confirmation: Although labeled as a continuation signal within the local pullback structure, price briefly made one final lower-low liquidity dip into late April near $850.00 before validating the underlying momentum buildup with a massive, multi-hundred-dollar bull rally into May and June.
- Actual Market Behavior: Bullish continuation/reversal occurred following the final April base formation.
Signal #2: Hidden Bullish Double Divergence (“H”) — May to July
- Divergence Type: Hidden Bullish Double Divergence (“H”).
- Expected Market Behavior: Bullish trend continuation.
- Where It Appears: Spanning the pullbacks from May through early July, labeled with a blue “H” beneath the early July swing low.
- Price Movement: Price formed a clear higher low near $1,100.00 in early July compared to the lower structural swing points in May ($900.00–$1,000.00 region), as shown by the green ascending price line.
- Indicator Movement: The RSI indicator printed lower troughs across the corresponding swing points (reflected by the green descending line in the upper RSI panel), dipping deeper than price movement suggested.
- Context & Confirmation: This combination (price holding higher structural lows while momentum drops deeper) indicates strong underlying bull market absorption. Sellers drove the indicator down, but price structural integrity held firm. The signal was confirmed as price immediately rebounded off the $1,100.00 support floor to push to new swing highs above $1,200.00 in mid-July.
- Actual Market Behavior: Trend continuation occurred as expected.
Signal #3: Hidden Bullish Double Divergence (“H”) — June to Late July
- Divergence Type: Hidden Bullish Double Divergence (“H”).
- Expected Market Behavior: Bullish trend continuation.
- Where It Appears: Formed across the reaction lows of June and late July/early August, marked by the second blue “H” under the late July pullback.
- Price Movement: Price again maintained a higher structural low around $1,100.00–$1,120.00 relative to previous structural swing lows, keeping the primary higher-low sequence intact.
- Indicator Movement: The RSI printed a lower relative trough across the multi-point baseline, sloping downward.
- Context & Confirmation: This second continuation signal re-confirmed that dip-buyers were actively absorbing sell orders at elevated support ($1,100.00). Price confirmed the signal by launching a fresh rally from late July into early August, driving price to its macro high above $1,250.00.
- Actual Market Behavior: Trend continuation occurred as expected.
Signal #4: Regular Bearish Double Divergence (“R”) — June to Mid-July
- Divergence Type: Regular Bearish Double Divergence (“R”).
- Expected Market Behavior: Potential trend exhaustion and bearish reversal.
- Where It Appears: Located at the prominent price peak in mid-July, labeled with an orange “R” above the price candles.
- Price Movement: Price forged higher highs, rising from the June peak toward $1,220.00+ in mid-July (connected by orange/green trendlines across price peaks).
- Indicator Movement: The RSI oscillator failed to confirm these higher price peaks, printing lower momentum highs across both historical reference points.
- Context & Confirmation: The signal warned of buyer exhaustion at elevated valuations. Following its appearance, price experienced an immediate short-term pull-back, falling back from $1,220.00+ toward the $1,100.00 support area in late July, confirming localized trend exhaustion.
- Actual Market Behavior: Short-term bearish reversal/pullback occurred.
Signal #5: Regular Bearish Double Divergence (“R”) — June to August Peak
- Divergence Type: Regular Bearish Double Divergence (“R”).
- Expected Market Behavior: Potential major trend exhaustion and bearish reversal.
- Where It Appears: At the macro peak of the entire chart in early August, highlighted by an orange line connecting three price highs and labeled with a yellow “R”.
- Price Movement: Price pushed to a new high above $1,250.00, completing a three-point pattern of higher price highs relative to the June and July peaks.
- Indicator Movement: The RSI panel (highlighted by the orange line in the lower panel) exhibited severe momentum decay, printing a significantly lower high during the August peak compared to the June peak.
- Context & Confirmation: This major multi-point divergence signaled severe structural buying exhaustion. The higher price high in August was achieved on fading momentum, setting up a high-probability reversal. Confirmation occurred swiftly as price suffered a sharp breakdown from above $1,250.00 down to $1,100.00 in mid-to-late August, halting the macro uptrend and establishing the primary resistance peak.
- Actual Market Behavior: Major bearish reversal occurred, bringing an end to the vertical advance.
Technical Scenarios
                       ┌─────────────────────────────────────────┐
                       │       LLY CONDITIONAL SCENARIOS         │
                       └────────────────────┬────────────────────┘
                                            │
        ┌───────────────────────────────────┼───────────────────────────────────┐
        ▼                                   ▼                                   ▼
┌───────────────┐                   ┌───────────────┐                   ┌───────────────┐
│Bullish Scenario│                   │Bearish Scenario│                   │Neutral Scenario│
├───────────────┤                   ├───────────────┤                   ├───────────────┤
│• Hold > $1,150│                   │• Break < $1,100│                   │• Range $1,120 │
│• Break > $1,200│                   │• Target $1,000 │                   │  to $1,200    │
│• Target $1,250│                   │• Risk: $850   │                   │• RSI at ~50   │
└───────────────┘                   └───────────────┘                   └───────────────┘
Bullish Scenario
For buyers to reassert control, price must hold above the immediate pivot support at $1,150.00 and achieve a daily close above $1,200.00. A sustained break above $1,200.00 would open the path for a retest of the major resistance zone at $1,250.00–$1,270.00, signaling that the post-divergence consolidation phase has resolved to the upside.
Bearish Scenario
If selling pressure resumes and price breaks decisively below the $1,100.00 structural support floor, it would signal a breakdown of the intermediate higher-low structure. This would open downside risk toward the psychological $1,000.00 round number, with macro invalidation testing the major $850.00 baseline demand zone.
Neutral / Range Scenario
Given that the RSI oscillator has normalized to 47.24 near its neutral 50.00 line, LLY may continue to consolidate sideways between $1,120.00 support and $1,200.00 resistance. This would allow price structure to absorb previous gains before attempting the next directional move.
Risk and Invalidation
- Bullish Invalidation Level: A daily close below $1,100.00 invalidates the current support base and the higher-low structure established by the July Hidden Bullish Double Divergence signals.
- Bearish Invalidation Level: A daily close above $1,270.00 invalidates the Regular Bearish Double Divergence top, proving that buyers have overcome the momentum exhaustion signal to resume the macro uptrend.
Key Levels Summary
| Level / Zone | Role | Technical Significance |
| $1,250.00 – $1,270.00 | Major Resistance | Macro peak of the rally; location of major Regular Bearish Double Divergence (“R”). |
| $1,200.00 | Intermediate Resistance | Key psychological level and upper boundary of recent consolidation. |
| $1,152.93 – $1,180.16 | Current Price / Pivot | Neutral midpoint zone; current daily close area ($1,180.16). |
| $1,100.00 – $1,120.00 | Major Structural Support | Critical reaction floor holding the “H” continuation signals and recent swing lows. |
| $850.00 – $870.00 | Macro Demand Support | April baseline origin of the major multi-month bull trend. |
Technical Outlook
The daily chart of Eli Lilly and Company presents a complete market cycle of momentum interaction. The initial advance was supported and extended by multiple Hidden Bullish Double Divergence signals (“H”) in June and July, which correctly signaled trend continuation off the $1,100.00 support floor.
However, as price reached new all-time highs above $1,250.00 in August, momentum failed to confirm the price expansion, generating a major Regular Bearish Double Divergence (“R”). This exhaustion signal triggered a sharp pullback back to $1,100.00.
With price currently stabilizing around $1,180.16 and the RSI indicator sitting at a neutral 47.24, LLY is in a structural consolidation phase. Intermediate traders should watch the key boundaries at $1,100.00 (support) and $1,200.00 (resistance) for the next confirmed directional breakout.
Educational Conclusion
This LLY chart offers key lessons on integrating multi-point divergence with price structure:
- Divergence Serves Different Roles: Hidden divergence (“H”) identifies continuation opportunities within an established trend, whereas Regular divergence (“R”) warns of major trend exhaustion and reversal potential.
- Multi-Point Validation Increases Reliability: By requiring a three-point structural alignment across consecutive swings, Double Divergence filters out premature signals that often occur during strong momentum trends.
- Price Confirmation Remains Paramount: An indicator signal highlights a potential shift, but the shift is only tradeable when price confirms it by breaking or respecting key structural support and resistance boundaries.
Frequently Asked Questions
What do the “H” and “R” labels mean on the LLY chart?
The “H” labels designate Hidden Bullish Double Divergence signals (indicating potential trend continuation after pullbacks). The “R” labels designate Regular Bearish Double Divergence signals (indicating potential trend reversal/exhaustion at price peaks).
How did the Regular Bearish Double Divergence (“R”) impact LLY stock in August?
The “R” signal in August warned that price was making higher highs above $1,250.00 while RSI momentum was making lower highs. This momentum exhaustion was confirmed when price experienced a sharp sell-off from above $1,250.00 down to the $1,100.00 support level.
What is the current market condition for LLY?
LLY is currently in a consolidation phase between $1,100.00 support and $1,200.00 resistance, with the RSI oscillator sitting at a neutral reading of 47.24.
Which key price level would invalidate the bullish structure for LLY?
A daily close below the $1,100.00 major support zone would invalidate the structural higher-low sequence and signal further downside risk.
Looking for the complete mathematical breakdown, step-by-step optimization guides, and advanced trading strategies? Explore our comprehensive documentation:
Visit the Technical Inputs Manual: Double Divergence Pro for full parameter tuning.
Read the master guide on the Double Divergence Indicator Series.