Analyze Momentum Shifts and Reversal Conditions on MetaTrader 4
RSI Double Divergence Pro for MT4 combines the Relative Strength Index (RSI) with PatternSmart’s Double Divergence methodology to help traders analyze momentum shifts, momentum exhaustion, reversal timing, and changing buying and selling pressure.
RSI is widely used to study the speed and magnitude of recent price movement. While RSI is often described simply through overbought and oversold levels, its broader analytical value comes from understanding how momentum changes as price develops.
When price continues moving in one direction while RSI begins behaving differently, the relationship can provide additional information about the market’s underlying momentum.
Double Divergence adds a structured framework for evaluating that relationship across multiple relevant price movements.

What Is RSI Double Divergence?
Traditional divergence compares price movement with indicator movement.
Double Divergence extends this concept by examining the relationship between price and RSI across multiple relevant price swings.
The central question is:
Is momentum continuing to support what price is doing?
For example, price may continue making higher highs while RSI fails to confirm the strength of those advances. Alternatively, price may continue declining while downside momentum begins to weaken.
These situations can provide valuable information about changing market conditions.
However, divergence does not guarantee that price will reverse. It is an analytical observation that should be evaluated alongside price action, market structure, and additional confirmation.
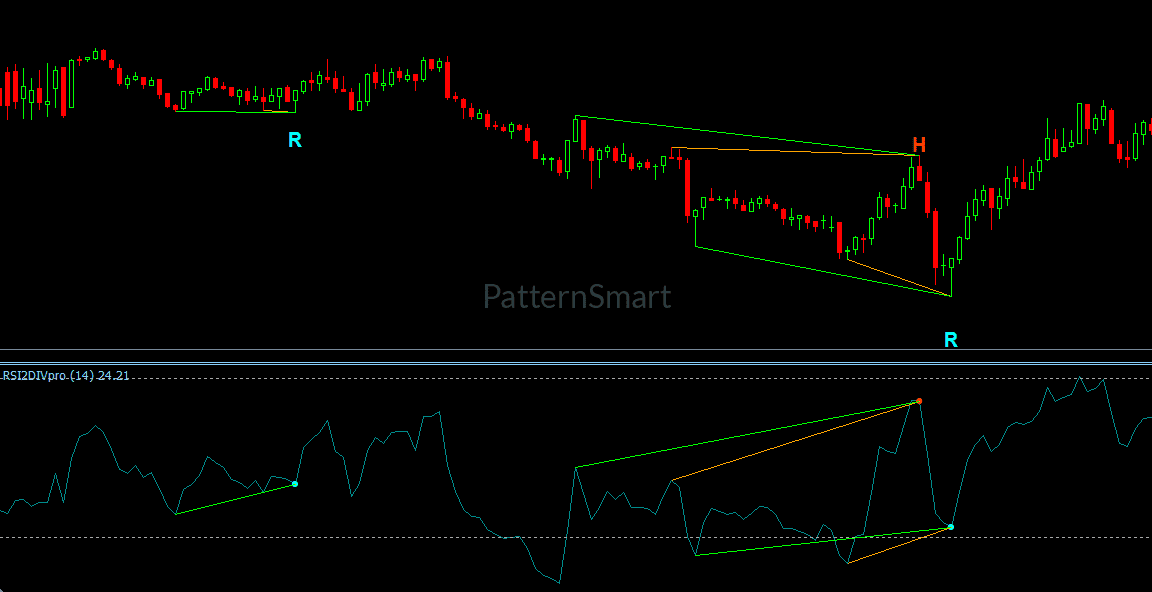
Why RSI Momentum Matters
Price direction and price momentum are related, but they are not identical.
A market can continue rising while the rate and magnitude of its recent movement begin to weaken. Similarly, a declining market can continue making new lows even as downside momentum begins losing strength.
RSI provides a way to examine these changes in momentum.
This makes RSI particularly useful for studying:
- Momentum shifts
- Momentum exhaustion
- Reversal timing
- Buying pressure
- Selling pressure
- Changing market psychology
The important point is that RSI should not be viewed solely as an overbought or oversold indicator. Its relationship with price can provide a broader perspective on changing momentum.
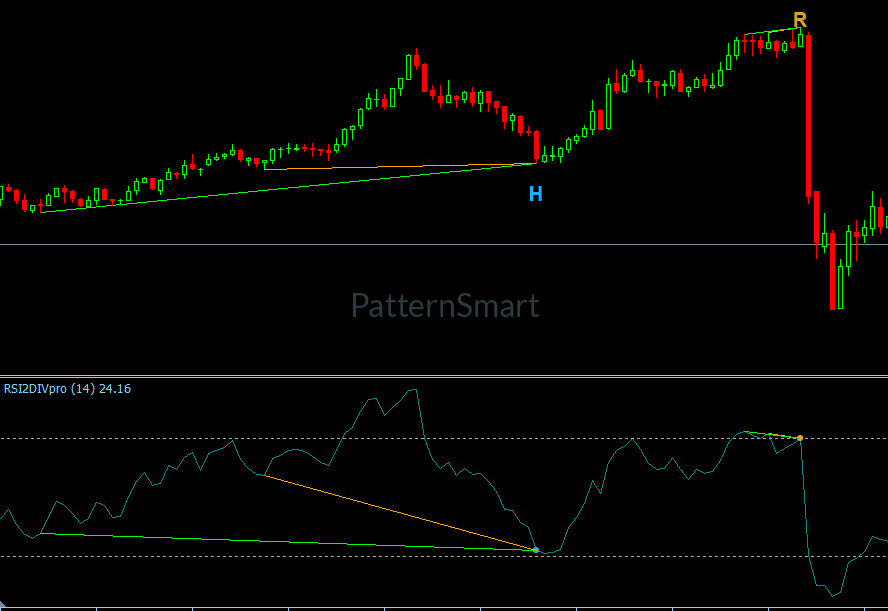
RSI Double Divergence and Momentum Exhaustion
Momentum exhaustion occurs when price continues moving in the same direction while the underlying momentum becomes less supportive.
Consider an advancing market.
Price may continue producing higher highs, but RSI may fail to produce corresponding higher highs. This does not automatically mean that the market will reverse.
Instead, it suggests that the momentum behind the latest price movement may be changing.
The same principle applies to declining markets.
Price may continue producing lower lows while RSI becomes less negative or fails to confirm the latest weakness.
Double Divergence provides a structured way to study these relationships rather than relying on a single RSI reading.
Understanding the Four Double Divergence Signals
RSI Double Divergence Pro supports four primary Double Divergence categories.
Bullish Regular Double Divergence
Bullish Regular Double Divergence occurs when price forms lower lows while RSI fails to confirm the corresponding weakness.
This may indicate that downside momentum is weakening.
When this occurs after an extended decline, the relationship can provide additional information when evaluating potential reversal conditions.
The divergence itself does not determine when or whether a reversal will occur. Price structure and confirmation remain important.
Bearish Regular Double Divergence
Bearish Regular Double Divergence occurs when price forms higher highs while RSI fails to confirm the continued strength.
This can indicate weakening upside momentum.
When an advancing market continues making new highs while RSI shows a less supportive structure, traders may want to examine whether the current movement is losing momentum.
Again, this is an observation rather than a guaranteed reversal signal.
Bullish Hidden Double Divergence
Bullish Hidden Double Divergence is generally associated with potential continuation after a pullback.
Price forms a higher low while RSI forms a lower low.
This relationship can provide additional information when evaluating whether an established bullish structure remains intact following a temporary decline.
Bearish Hidden Double Divergence
Bearish Hidden Double Divergence is generally associated with potential continuation within a bearish market structure.
Price forms a lower high while RSI forms a higher high.
This can help traders examine whether an upward pullback may be occurring within a broader bearish structure.
Regular and Hidden Divergence therefore provide different analytical perspectives: regular divergence is commonly associated with potential exhaustion and reversal conditions, while hidden divergence is commonly associated with continuation analysis.

RSI and Reversal Timing
RSI Double Divergence is particularly relevant when studying potential turning points after extended price movement.
The key distinction is between identifying an extended movement and identifying evidence that its momentum may be changing.
A market can remain overextended for longer than expected.
Therefore, simply reaching an extreme RSI level is not enough to establish that a reversal is developing.
Double Divergence adds another layer of analysis by examining whether RSI confirms the price movement across relevant swings.
A practical evaluation can therefore consider:
- How far has price moved?
- What is the current market structure?
- Is momentum strengthening or weakening?
- Does RSI confirm the latest price movement?
- Is a Regular or Hidden Double Divergence present?
- Does additional price-action evidence support the observation?
This helps turn RSI from a simple threshold-based tool into a broader momentum-analysis framework.
Buying and Selling Pressure
RSI also provides another way to think about buying and selling pressure.
When price continues rising, traders can examine whether RSI continues to reflect comparable momentum.
When price declines, the same analysis can be applied to downside pressure.
A divergence between price and RSI may indicate that the balance of momentum is changing even though price has not yet fully responded.
This can be particularly useful for traders interested in market psychology.
Strong price movement accompanied by weakening momentum can tell a different analytical story from strong price movement accompanied by continuing momentum confirmation.
The purpose of Double Divergence is to help make this difference easier to examine systematically.
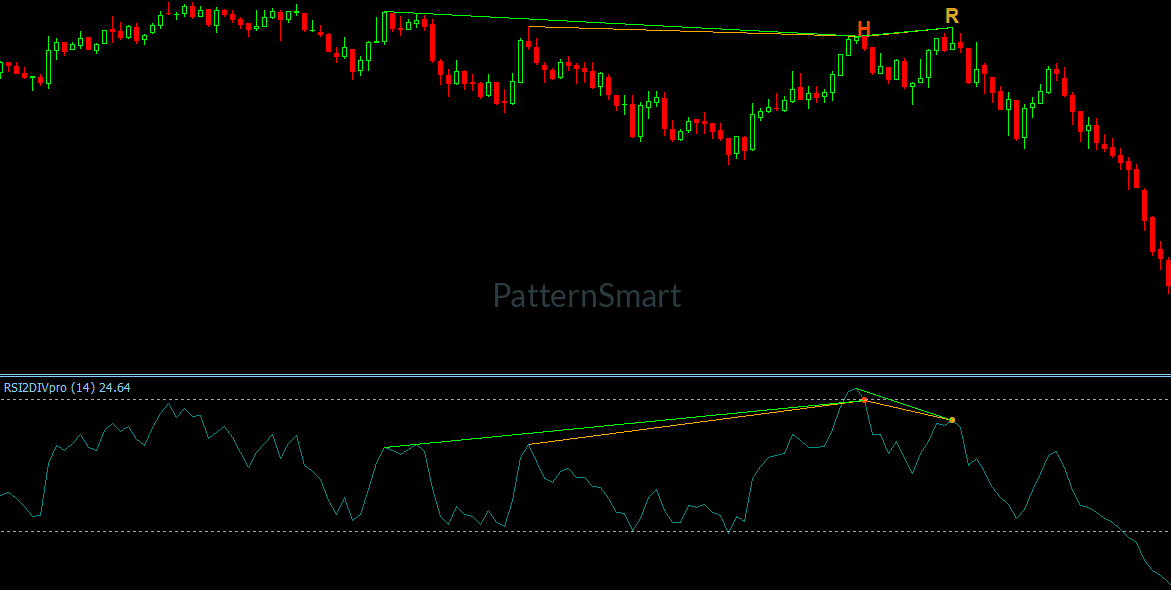
A Confirmation-First Approach to RSI Divergence
PatternSmart’s Double Divergence methodology is built around a simple sequence:
Observe → Compare → Confirm → Interpret → Evaluate
The methodology does not treat divergence as a prediction engine or standalone trading strategy.
Instead, traders are encouraged to ask:
- What is price currently doing?
- What does RSI measure?
- Why are price and RSI behaving differently?
- Does additional market evidence support the observation?
- Does the divergence strengthen the overall technical picture?
This confirmation-first approach encourages more disciplined technical analysis and reduces the tendency to react immediately to isolated divergence observations.
RSI Double Divergence for Different Market Conditions
The RSI Double Divergence knowledge base identifies several market environments where RSI analysis can be particularly relevant:
- Range-bound markets
- Swing markets
- Moderate trends
- Momentum-driven reversals
RSI Double Divergence is particularly suited to swing trading, short-term trading, reversal analysis, and multi-timeframe analysis.
One limitation is that RSI can generate numerous signals during strong trends. This is why market context and price-action confirmation remain essential.
RSI Double Divergence Pro for MT4
MetaTrader 4 is one of the most established retail trading platforms and remains widely used by Forex and CFD traders.
Its familiar interface, stable workflow, extensive customization, and broad broker support make it a practical environment for daily technical analysis.
MT4 traders commonly work with multiple charts and combine custom indicators with manual price analysis. RSI Double Divergence Pro integrates naturally into this workflow by providing structured momentum and divergence analysis without requiring traders to change their established chart-analysis process.
The platform affects workflow and presentation. It does not change the underlying Double Divergence methodology.
Flexible RSI Double Divergence Signal Selection
RSI Double Divergence Pro provides separate controls for the four primary signal types:
- Show Regular Bullish
- Show Regular Bearish
- Show Hidden Bullish
- Show Hidden Bearish
Each setting controls whether its corresponding Double Divergence type is calculated and displayed.
This allows traders to focus their charts on the divergence categories most relevant to their current analytical objective.
For example:
- Regular Bullish and Regular Bearish can be emphasized when studying potential reversal conditions.
- Hidden Bullish and Hidden Bearish can be emphasized when studying continuation after pullbacks.
Disabling one signal type does not change the underlying Double Divergence methodology or affect the other signal categories.
Wait 1 Bar for Additional Confirmation
Wait 1 Bar controls the timing of signal confirmation.
When enabled, the indicator waits until the next bar has completely closed before confirming a detected divergence signal.
When disabled, the signal is confirmed once the required divergence conditions have been satisfied.
This setting can provide an additional confirmation step and may help reduce premature signal confirmation during rapidly changing market conditions.
Importantly, it changes when the signal becomes visible, not how the divergence itself is detected.
Enhanced Mode for Structural Validation
Enhanced Mode applies additional structural filtering before a detected Double Divergence signal is confirmed.
It does not create a new type of divergence.
Instead, it adds another validation layer to the confirmation process.
This can be relevant for traders who want to place greater emphasis on structural consistency when evaluating potential RSI divergence signals.
Enhanced Mode is therefore best understood as a signal-filtering feature, not as a different trading methodology.
Advanced Parameters for Divergence Evaluation
The indicator includes several advanced parameters that influence how divergence structures are evaluated.
Divergence Bar Range
Divergence Bar Range defines the structural search boundaries used during divergence evaluation.
It controls the scope in which relevant divergence structures are examined.
Divergence Lookback
Divergence Lookback controls swing-point identification.
Changing it may influence:
- Swing point selection
- Structural sensitivity
- Divergence frequency
- Historical structure identification
Filter Length
Filter Length controls the internal smoothing period used during structural evaluation.
Increasing the value produces smoother structural evaluation, while reducing it produces more responsive structural evaluation.
These settings influence the internal analytical process. They do not change the underlying Double Divergence methodology.
Clear Chart Visualization
RSI Double Divergence Pro provides several display controls for reviewing confirmed signals directly on the MT4 chart.
Show Char
Displays text labels associated with confirmed divergence signals.
Show Line
Draws divergence lines between relevant price and indicator structures.
Only Show Last Signal Within Bars
Helps reduce chart clutter by removing older nearby signal objects.
Additional visualization controls include:
- Price Line Brush
- Price Line Dash Style
- Price Line Width
These settings affect presentation only. They do not change signal generation or divergence calculations.
Alerts for Confirmed RSI Divergence
RSI Double Divergence Pro also includes:
- Enable Alert
- Alert Sound
These features provide notifications after a valid Double Divergence signal has been confirmed.
Alert settings do not affect signal calculation or filtering. Their purpose is to communicate confirmed signals and improve workflow efficiency.
Practical Applications of RSI Double Divergence
Analyze Momentum Exhaustion
When price continues moving while RSI becomes less supportive, the relationship can provide additional information about weakening momentum.
Study Potential Reversal Conditions
Regular Double Divergence can help identify situations where price continues making new extremes while momentum fails to confirm the latest movement.
Evaluate Pullback Continuation
Hidden Double Divergence can provide additional information when studying whether a pullback may occur within an established trend.
Examine Buying and Selling Pressure
Changes in RSI momentum can provide another perspective on whether buying or selling pressure is strengthening or weakening.
Improve Reversal Timing Analysis
RSI Double Divergence can help organize momentum information when traders are evaluating potential turning points after extended price movement.
Support Multi-Timeframe Analysis
RSI Double Divergence can be incorporated into multi-timeframe workflows where traders examine momentum relationships across different chart perspectives.
RSI Double Divergence vs. Traditional RSI Analysis
A traditional RSI analysis may focus heavily on whether RSI has reached a particular level.
Double Divergence asks a different question:
Is RSI confirming the way price is developing across multiple relevant swings?
This distinction is important.
An RSI reading can become elevated or depressed without immediately producing a reversal.
By examining the relationship between price structure and RSI momentum, Double Divergence provides another analytical perspective.
This helps traders move beyond the simple assumption that an extreme RSI reading automatically means a reversal is imminent.
[Get Started With RSI Double Divergence Pro for MT4]
Looking for the complete mathematical breakdown, step-by-step optimization guides, and advanced trading strategies? Explore our comprehensive documentation:
Visit the Technical Inputs Manual: Double Divergence Pro for full parameter tuning.
Read the master guide on the Double Divergence Indicator Series.
Who Is RSI Double Divergence Pro for MT4?
RSI Double Divergence Pro may be particularly relevant for:
- Swing traders
- Active traders
- Technical analysts
- Reversal-focused traders
- Multi-market traders
- Forex traders using MetaTrader 4
- Traders studying momentum exhaustion
- Traders interested in market psychology and changing momentum
It is especially suited to traders who want to combine RSI momentum analysis with structured Double Divergence rather than relying solely on RSI levels.
Frequently Asked Questions
What does RSI Double Divergence measure?
RSI Double Divergence examines the relationship between price movement and RSI momentum across relevant price swings. RSI provides information about the speed and magnitude of recent price movement.
Is RSI only an overbought and oversold indicator?
No. Within the PatternSmart methodology, RSI is primarily discussed in terms of momentum, momentum exhaustion, reversal timing, buying pressure, and selling pressure. Overbought and oversold conditions are only one part of RSI analysis.
Does RSI divergence always predict a reversal?
No. Divergence can provide evidence of changing momentum, but it cannot determine with certainty whether a reversal will occur or when it will happen. Price action and broader market context remain important.
What is the difference between Regular and Hidden RSI Divergence?
Regular Divergence is generally associated with potential momentum exhaustion and reversal conditions. Hidden Divergence is generally associated with potential continuation following a temporary pullback.
Why can RSI divergence appear before price changes direction?
Momentum can begin changing before the corresponding price structure fully develops. RSI Double Divergence can therefore provide an early indication that the relationship between price and momentum is changing, but additional confirmation is still required.
Is RSI Double Divergence suitable for strong trends?
It can be used in trending markets, but the RSI knowledge base notes that strong trends may produce numerous signals. Market context and price-action confirmation are therefore important.
Is RSI Double Divergence suitable for swing trading?
Yes. Swing trading is one of the trading styles identified as particularly suitable for RSI Double Divergence, along with short-term trading, reversal trading, and multi-timeframe analysis.
What does Wait 1 Bar do?
When enabled, Wait 1 Bar requires one completed confirmation bar before a detected divergence signal is finalized. It changes confirmation timing rather than the underlying divergence methodology.
What does Enhanced Mode do?
Enhanced Mode applies additional structural validation before a potential divergence signal is confirmed. It functions as a signal-filtering feature rather than a separate divergence methodology.
Do display settings affect RSI divergence calculations?
No. Features such as Show Char, Show Line, and Only Show Last Signal Within Bars control how confirmed signals are presented. They do not change the underlying calculations.
Conclusion
RSI Double Divergence Pro for MT4 combines the momentum perspective of RSI with PatternSmart’s structured Double Divergence methodology.
The key analytical question is not simply whether RSI is high or low.
It is:
Is momentum continuing to support the way price is moving?
When price and RSI begin to disagree across multiple relevant swings, the resulting Double Divergence can provide additional information about momentum exhaustion, reversal potential, buying and selling pressure, and changing market psychology.
Regular Divergence can help traders examine potential exhaustion and reversal conditions, while Hidden Divergence provides another perspective on continuation following pullbacks.
For MT4 users, the indicator integrates this analysis into a familiar and reliable charting workflow.
The goal is not to replace price action or produce guaranteed predictions. Instead, RSI Double Divergence provides another layer of technical evidence that can help traders organize momentum analysis and evaluate market conditions more systematically.
Explore RSI Double Divergence Pro for MT4
Explore RSI Double Divergence Pro for MT4 to study momentum shifts, exhaustion, reversal timing, and changing buying and selling pressure within your existing MetaTrader 4 technical-analysis workflow.