Meta Platforms (META) Daily Technical Analysis: Evaluating Market Structure and Stochastics Double Divergence
Market Overview
The daily candlestick chart for Meta Platforms, Inc. (META) illustrates a complete structural market cycle, transitioning from an initial high-level consolidation to a prolonged corrective sell-off, followed by a violent reversal and an extended bullish expansion.
During the initial phase shown on the left, META traded in a broad high-level range near $600.00–$650.00 before experiencing a steady downward trend that broke through intermediate support levels, ultimately troughing below $550.00. Following this drop, price formed a prominent structural bottoming pattern that launched an aggressive upward rally. The stock surged past previous resistance barriers to reach new highs near $665.75, where it currently trades near its upper boundary.
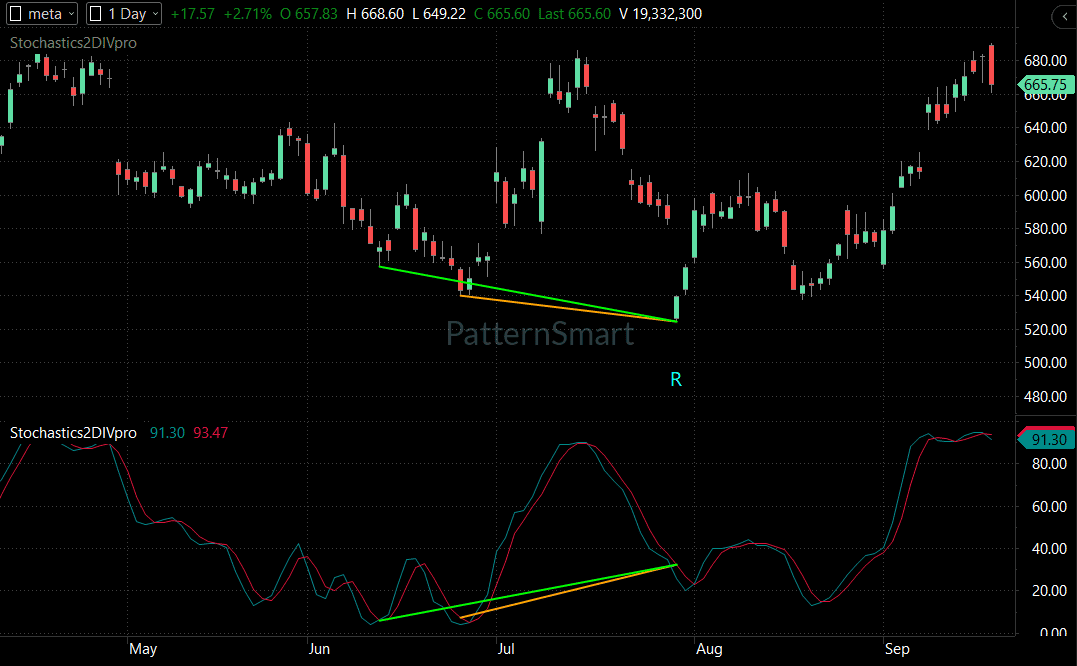
Chart Setup
- Instrument: Meta Platforms, Inc.
- Symbol: META
- Timeframe: Daily (1 Day)
- Chart Type: Candlestick Price Chart
- Primary Indicator: Stochastics Double Divergence (
Stochastics2DIVpro, currently reading %K 90.06, %D 92.51) - Last Visible Price: $562.60 at the time of snapshot bar data (Visible Price Scale Right: $665.75 current market level)
Price Action Analysis
Price action across the META daily chart displays distinct structural shifts:
- High-Level Range & Roll-Over (Early Phase): The stock consolidated near $600.00–$650.00 before losing momentum, forming a series of lower highs and lower lows that initiated a corrective channel.
- Accelerated Downtrend & Low Compression: As selling pressure increased, META broke below $600.00 and pressed down toward $550.00. During this decline, price forged three distinct, progressively lower swing lows (connected by the green and orange downward trendlines on the price chart).
- V-Shaped Reversal & Gap-Up: At the terminus of the third lower low, buyers aggressively stepped in, creating a powerful bullish response candle followed by an explosive gap-up that cleared the $600.00 level in short order.
- Bullish Trend Expansion: Following the gap and breakout, price maintained strong structural higher highs and higher lows, steadily driving up to the $665.75 region with overbought momentum readings.
Trend Analysis
The macro and short-term trends on META reflect a clean reversal and trend transition:
- Prior Trend: Intermediate Bearish. The price structure from the initial high-level drop down to the low below $550.00 established a clear lower-high, lower-low sequence.
- Trend Transition: A sharp V-bottom reversal occurred at the final low near $540.00–$550.00, marked by a Regular Bullish Double Divergence signal.
- Current Trend: Strongly Bullish. The stock is in an established uptrend, consistently printing higher highs and higher lows above all intermediate moving averages and previous breakdown zones.
Key Support and Resistance Levels
Visible price zones define critical structural boundaries for META:
- Immediate Overhead Resistance ($665.75 – $670.00): The current peak of the trend expansion visible on the far right of the chart.
- Intermediate Support / Breakout Zone ($600.00): A former consolidation zone and psychological level that acted as major resistance during the rally origin and now serves as intermediate pullback support.
- Major Structural Support Floor ($540.00 – $550.00): The multi-touch low zone where the three lower price troughs formed, serving as the springboard for the macro reversal.
Momentum Analysis
The lower indicator panel displays the Stochastics2DIVpro oscillator, currently reading 90.06 / 92.51 in the deep overbought territory:
- Oversold Compression: During the sell-off to $540.00–$550.00, the Stochastic lines compressed deep near the 0.00 baseline.
- Divergent Trough Formation: While price pushed to three progressively lower lows, the Stochastic lines refused to print lower lows, creating a prominent horizontal/slightly rising baseline across three consecutive indicator troughs.
- Momentum Surge: Following the divergence signal, the Stochastic lines surged rapidly above the 50.00 midpoint and have remained pinned near the 90.00+ overbought ceiling during the ongoing expansion.
Signal-by-Signal Double Divergence Analysis
The chart highlights a single, highly pronounced Regular Bullish Double Divergence signal, identified on the price panel by green and orange downward trendlines and labeled with a cyan “R” marker beneath the turning point candle.
                    ┌─────────────────────────────────────────┐
                    │     META STOCHASTICS DOUBLE DIVERGENCE  │
                    └────────────────────┬────────────────────┘
                                         │
                                         ▼
                    ┌─────────────────────────────────────────┐
                    │  Regular Bullish Double Divergence ("R")│
                    ├─────────────────────────────────────────┤
                    │ • Price: 3 Progressively Lower Lows     │
                    │ • Indicator: Equal/Higher Troughs       │
                    │ • Implication: Downward Exhaustion      │
                    │ • Result: Successful Major Reversal     │
                    └─────────────────────────────────────────┘
Signal #1: Regular Bullish Double Divergence (“R”) — Bottoming Phase
- Divergence Type: Regular Bullish Double Divergence (“R”).
- Expected Market Behavior: Potential major trend reversal from a downtrend to an uptrend due to downward momentum exhaustion.
- Where It Appears: Appears across three consecutive price troughs in the bottoming phase around $540.00–$550.00, marked by a cyan “R” beneath the final rejection candle.
- Price Movement: Price made three progressively lower swing lows (connected by the upper green trendline and lower orange trendline sloping distinctly downward). Sellers were successfully pushing price to lower absolute price levels.
- Indicator Movement: On the
Stochastics2DIVpropanel, the oscillator failed to confirm the lower price lows. Instead, the Stochastic lines formed equal to slightly higher troughs across the three reference points (highlighted by the corresponding green and orange horizontal/upward-sloping trendlines near the 0.00 line). - Signal Interpretation: This structural misalignment represents classic downward momentum exhaustion. While supply was sufficient to drive price to marginal new lows, the underlying velocity of the selling pressure was completely drained across two historical reference points.
- Actual Market Behavior & Confirmation: Price provided immediate, aggressive confirmation. Following the “R” signal, a large green expansion candle formed off the $540.00 floor, immediately followed by an explosive gap-up above $580.00. The reversal fully succeeded, launching a rally that carried META all the way to $665.75 without breaking structural support.
Price Confirmation vs. Indicator Signal
It is essential to separate the initial indicator signal from subsequent price confirmation:
- The Indicator Signal: The appearance of the cyan “R” alerted traders that selling momentum had flattened out across three consecutive price attempts, creating a high-probability condition for a bottom.
- Price Confirmation: Confirmation occurred only when price printed a strong bullish engulfing candle off the lower orange trendline, followed by a gap-up past intermediate resistance at $580.00–$600.00. This price action verified that buyers had stepped in to reclaim structural control.
Technical Scenarios
                       ┌─────────────────────────────────────────┐
                       │        META CONDITIONAL SCENARIOS       │
                       └────────────────────┬────────────────────┘
                                            │
        ┌───────────────────────────────────┼───────────────────────────────────┐
        ▼                                   ▼                                   ▼
┌───────────────┐                   ┌───────────────┐                   ┌───────────────┐
│Bullish Scenario│                   │Bearish Scenario│                   │Neutral Scenario│
├───────────────┤                   ├───────────────┤                   ├───────────────┤
│• Hold > $650  │                   │• Break < $600 │                   │• Range $620   │
│• Break > $670 │                   │• Retest $550  │                   │  to $665      │
│• Target New   │                   │• Invalidates  │                   │• Stochastics  │
│  Highs        │                   │  Uptrend      │                   │  Cools Off    │
└───────────────┘                   └───────────────┘                   └───────────────┘
Bullish Scenario
If price maintains its current momentum above the $650.00 intermediate floor, buyers could push for a decisive breakout above the current $665.75–$670.00 resistance high. A sustained close above $670.00 would open the way for further upside expansion into blue-sky territory.
Bearish Scenario
If sellers re-emerge and force price back below $650.00, a deeper corrective pullback toward the major pivot support at $600.00 could unfold. A breakdown below $600.00 would weaken the short-term trend structure and increase the likelihood of retesting lower support zones.
Neutral / Range Scenario
With the Stochastics indicator currently pinned in extreme overbought territory (>90.00), price may consolidate sideways between $630.00 and $665.00. This would allow momentum to cool off without causing structural damage to the primary uptrend.
Risk and Invalidation
- Bullish Trend Invalidation: A daily close below the $600.00 major breakout pivot would invalidate the short-term bullish momentum structure.
- Macro Reversal Invalidation: A breakdown below the primary reaction low at $540.00 would completely invalidate the Regular Bullish Double Divergence bottoming structure, indicating that sellers have re-established macro downtrend control.
Key Levels Summary
| Level / Zone | Role | Technical Significance |
| $665.75 – $670.00 | Overhead Resistance | Current high of the multi-month expansion move. |
| $630.00 – $650.00 | Immediate Support | Local consolidation base and short-term pullback boundary. |
| $600.00 | Major Breakout Support | Former resistance zone and key structural pivot. |
| $540.00 – $550.00 | Structural Demand Floor | Location of “R” signal; origin of macro reversal. |
Technical Outlook
Meta Platforms (META) presents a clear example of a successful momentum-driven trend reversal. The emergence of a Regular Bullish Double Divergence (“R”) across three lower price lows in the $540.00–$550.00 region correctly flagged severe seller exhaustion. Subsequent price action confirmed the signal via a gap-up breakout above $600.00, driving the stock to current highs near $665.75. While overbought Stochastics readings (90.06 / 92.51) suggest potential short-term consolidation, the broader structural bias remains strongly bullish as long as price holds above $600.00.
Educational Conclusion
This META chart demonstrates key principles of trading Double Divergence:
- Multi-Point Divergence Filters False Reversals: Single-point divergences frequently fail in strong trends. By demanding a three-point structural alignment (three lower price lows against equal/higher oscillator troughs), Double Divergence provides significantly higher signal reliability.
- Context Matters More Than the Indicator: The divergence signal identified potential exhaustion, but the actual trade edge was validated by market structure—specifically, the aggressive rejection candle and gap-up off the $540.00 demand floor.
- Respect Invalidation Boundaries: Every technical signal requires a clear invalidation level. For a Regular Bullish Double Divergence, the lowest point of the divergence pattern ($540.00) serves as the ultimate line in the sand for risk control.
Frequently Asked Questions
What does the cyan “R” label on the META chart mean?
The cyan “R” label stands for Regular Bullish Double Divergence. It indicates a potential major trend reversal condition where price makes three lower lows while the momentum indicator makes equal or higher troughs, signaling downward momentum exhaustion.
How did the Stochastics Double Divergence perform on this chart?
The signal performed exceptionally well. After the “R” signal printed near $540.00–$550.00, META experienced an immediate V-shaped reversal and gap-up, rallying over 20% to reach $665.75.
What is the difference between Regular and Hidden Double Divergence?
Regular Double Divergence signals potential trend reversals (e.g., lower price lows with higher indicator troughs). Hidden Double Divergence signals potential trend continuation after pullbacks (e.g., higher price lows with deeper indicator troughs).
What level invalidates the current META bullish trend?
A daily close below the key breakout pivot level at $600.00 would signal short-term structural failure, while a close below $540.00 would fully invalidate the macro reversal structure.
Looking for the complete mathematical breakdown, step-by-step optimization guides, and advanced trading strategies? Explore our comprehensive documentation:
Visit the Technical Inputs Manual: Double Divergence Pro for full parameter tuning.
Read the master guide on the Double Divergence Indicator Series.