When navigating a prolonged downtrend, technical analysts constantly look for signs that selling pressure is exhausting itself. One of the more nuanced, multi-candle structures signaling this shift is the Homing Pigeon.
While less famous than the Hammer or the Bullish Engulfing pattern, the Homing Pigeon offers vital clues into shifting market psychology.
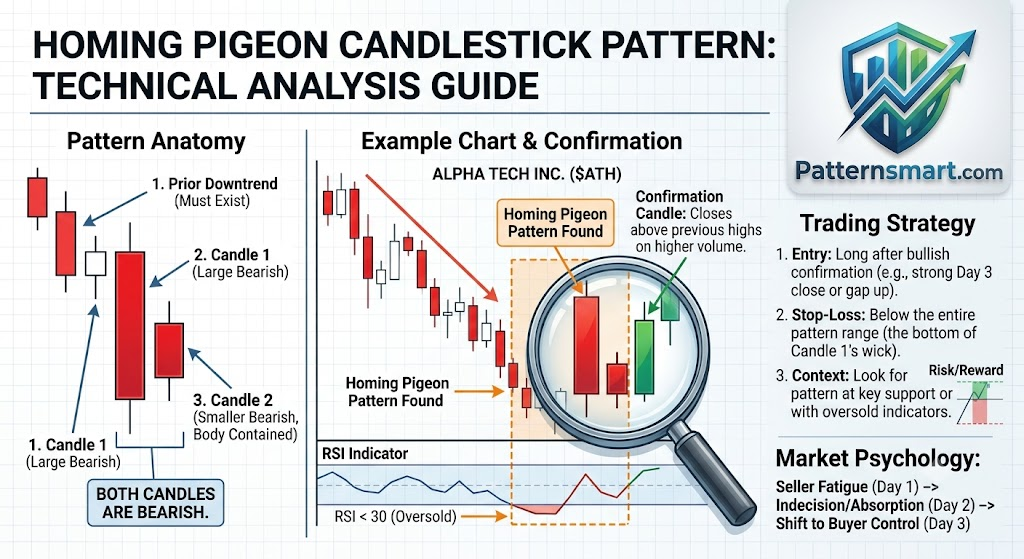
Anatomy of a Homing Pigeon
The Homing Pigeon is a two-candle bullish reversal pattern that occurs exclusively within a defined downtrend. Visually, it looks almost identical to a Bullish Harami, with one critical difference: both candles in a Homing Pigeon must be bearish (red/black).
For a pattern to be valid, it must meet three strict criteria:
- The Context: The asset must be in a clear, established markdown phase or downtrend.
- Candle 1: A large, bearish candle that reinforces the current downward momentum.
- Candle 2: A smaller bearish candle whose entire real body is completely contained (engulfed) within the real body of the first candle. The shadows (wicks) do not necessarily have to be contained, though the pattern is stronger if they are.
Shifting Market Psychology
To trade this pattern effectively, you have to understand the battle going on between buyers and sellers behind the scenes.
- Day 1 (The Trap): Sellers are firmly in control. The asset prints a large red candle, hitting new local lows. Bears feel confident that the trend will continue smoothly.
- Day 2 (The Friction): The second day gaps open higher than the previous day’s close. This unexpected gap immediately puts short-sellers on edge. Throughout the session, sellers try to push the price lower, but they fail to break below Day 1’s open or close. It closes as a small red candle completely “inside” the first.
This compressing price action indicates loss of momentum. The bears could not push prices to new lows despite having the wind at their backs. It signals that institutional accumulation or heavy profit-taking is quietly stabilizing the asset.
Trading Strategy: Execution & Risk Management
You should never trade a Homing Pigeon blindly upon completion of the second candle. According to historical quantitative testing (most notably by Thomas Bulkowski), the Homing Pigeon actually acts as a continuation pattern roughly 56% of the time without confirmation.
Therefore, waiting for confirmation is mandatory.
1. Entry Protocol
- The Trigger: Wait for a third candle to break and close above the real body of the first candle in the pattern.
- Volume Check: Look for a spike in volume on the confirmation candle to ensure institutional backing of the reversal.
2. Risk Management (Stop-Loss)
Place your stop-loss order slightly below the lowest point of the entire pattern (usually the low of Candle 1). If the price drops below this level, the bullish thesis is invalidated, and the downtrend remains intact.
3. Profit Targets
Measure the height of the Homing Pigeon pattern (High of Candle 1 minus Low of Candle 1). Project that same distance upward from your entry point for a conservative Target 1. For Target 2, look up-chart to align with major overhead resistance levels or moving averages.
Comparison: Homing Pigeon vs. Bullish Harami
Because they share a structural framework, traders frequently confuse these two patterns.
| Feature | Homing Pigeon | Bullish Harami |
| Trend Context | Downtrend | Downtrend |
| Candle 1 Color | Bearish (Red/Black) | Bearish (Red/Black) |
| Candle 2 Color | Bearish (Red/Black) | Bullish (Green/White) |
| Implication | Potential Bullish Reversal | Potential Bullish Reversal |
The Key Takeaway: The Homing Pigeon’s second candle closing red shows that sellers are still present but completely lack the strength to drive expansion. The Harami’s second green candle shows an active, immediate counter-attack by buyers.
Summary for the Trader’s Playbook
The Homing Pigeon acts as an early warning system. It tells you to stop aggressively shorting an asset and prepare for a potential change in tide. For the best results, look for this pattern when the asset is simultaneously testing structural support levels (like a major horizontal support zone) or printing an oversold reading on the Relative Strength Index (RSI).
Please check our Bullish Patterns Indicator collection.