What Is the Concealing Baby Swallow Pattern?
The Concealing Baby Swallow is a rare four-candlestick bullish reversal pattern found in Japanese candlestick analysis. It typically appears during a strong downtrend and signals that bearish momentum may be reaching exhaustion, potentially leading to a bullish reversal.
Unlike many reversal patterns that display obvious buying pressure, the Concealing Baby Swallow initially appears extremely bearish. The reversal signal emerges only after the final candle completely engulfs the previous candle, suggesting that sellers have lost control and buyers are beginning to enter the market.
Because of its rarity, traders generally use this pattern alongside other technical indicators and confirmation signals rather than relying on it alone.
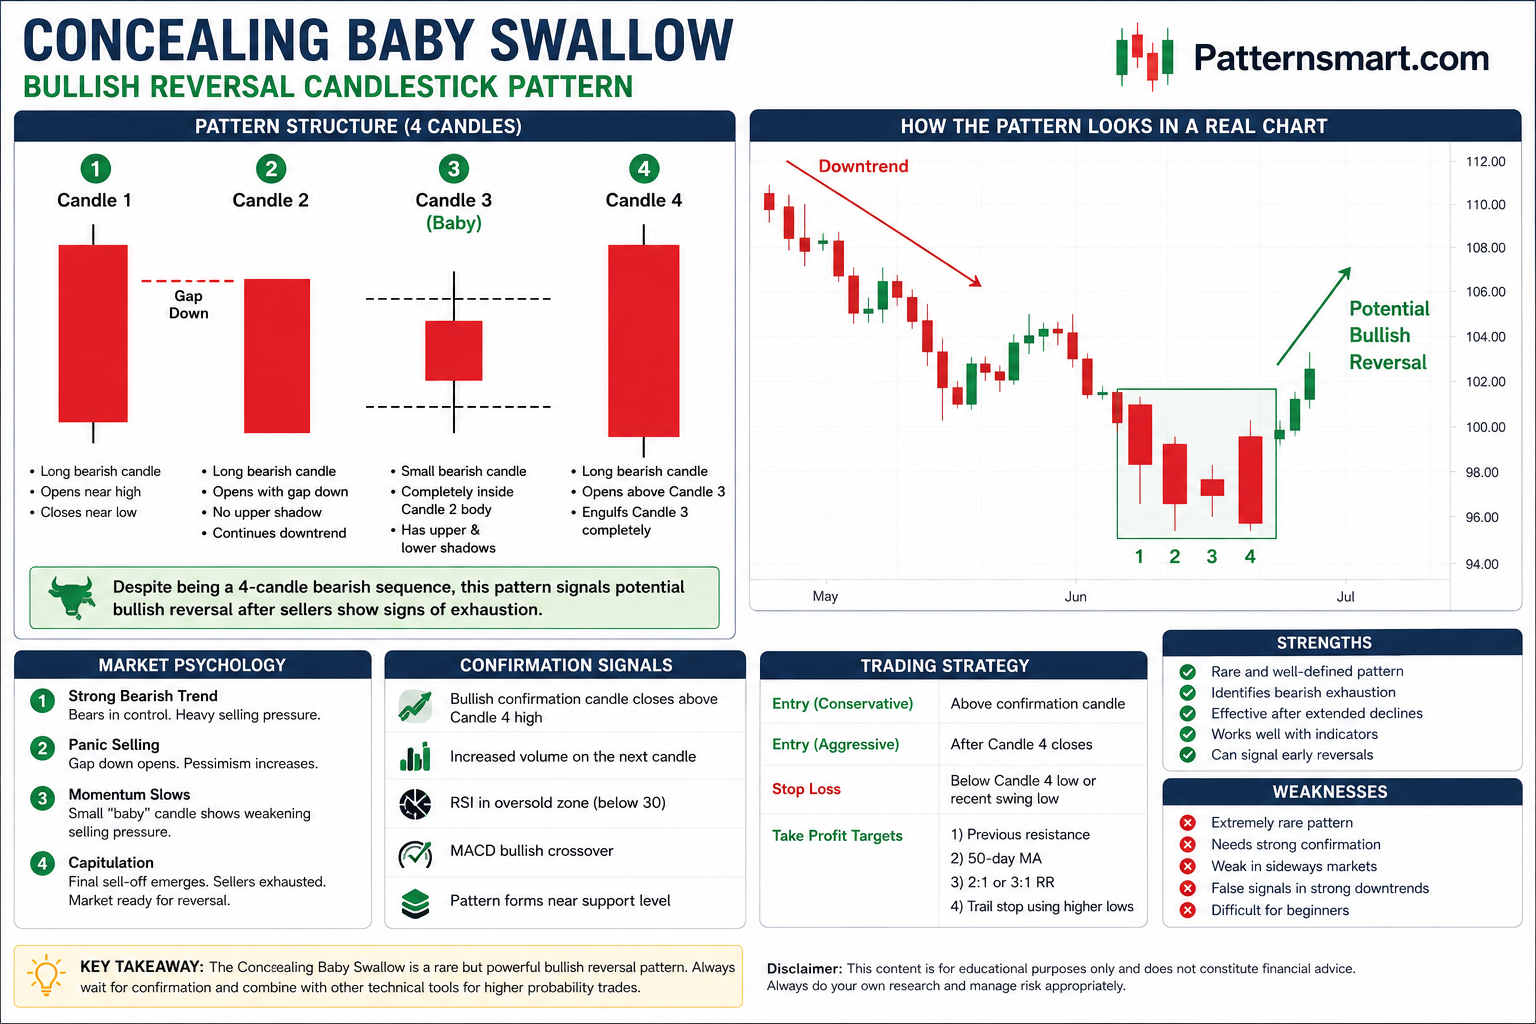
Pattern Structure
The Concealing Baby Swallow consists of four consecutive bearish candles with very specific characteristics.
Candle 1
- Long bearish (black/red) candle.
- Opens near its high.
- Closes near its low.
- Shows strong selling pressure.
Market psychology:
Bears remain firmly in control and continue pushing prices lower.
Candle 2
- Another long bearish candle.
- Opens with a downward gap below Candle 1.
- Has no upper shadow.
- Continues the downtrend.
Market psychology:
Selling accelerates, and market participants become increasingly pessimistic.
Candle 3
- Small bearish candle.
- Completely contained within Candle 2’s body.
- Has upper and lower shadows.
This candle is called the “baby.”
Market psychology:
Selling begins to lose momentum. Although bears still dominate, downward progress slows noticeably.
Candle 4
- Long bearish candle.
- Opens above Candle 3.
- Falls sharply during the session.
- Completely engulfs Candle 3, including both shadows.
Despite closing lower, this candle creates the reversal setup.
Market psychology:
The final sell-off may represent panic selling or capitulation. After this exhaustion phase, bearish momentum frequently weakens substantially.
Visual Illustration
Downtrend

Candle 1      ████
              ████
              ████

Gap Down

Candle 2        ████
                ████
                ████

Candle 3         ██
                ─────
                 ██

Candle 4       ██████
               ██████
               ██████

Potential Bullish Reversal
          ↑
Identification Rules
A valid Concealing Baby Swallow should satisfy the following conditions:
- Existing downtrend
- Four consecutive bearish candles
- First two candles are long bearish candles
- Second candle opens with a downward gap
- Second candle has no upper shadow
- Third candle is completely inside Candle 2
- Third candle has visible shadows
- Fourth candle completely engulfs Candle 3
- Pattern forms after extended selling pressure
Market Psychology
Understanding the psychology behind the pattern is more valuable than memorizing its shape.
Stage 1 — Strong Bearish Trend
The first candle confirms aggressive selling.
Everyone expects prices to continue falling.
Stage 2 — Panic Selling
The second candle gaps lower.
Confidence among bears reaches its highest level.
Most buyers have already exited.
Stage 3 — Momentum Slows
The third candle becomes much smaller.
Although sellers remain dominant, the decline loses momentum.
Some bargain hunters quietly begin accumulating.
Stage 4 — Final Capitulation
The fourth candle initially suggests another wave of heavy selling.
However, this aggressive sell-off often represents the final exhaustion move.
Professional traders frequently view this as capitulation rather than fresh bearish strength.
The market then becomes vulnerable to a bullish reversal.
Trend Context
The Concealing Baby Swallow should only be considered reliable when it appears after:
- prolonged declines
- oversold markets
- strong bearish momentum
- panic-driven selling
It carries little significance during sideways markets.
Confirmation Signals
Professional traders usually wait for additional confirmation before entering.
Useful confirmations include:
Bullish Confirmation Candle
The next candle closes above the high of Candle 4.
Increased Volume
Higher trading volume after the pattern indicates institutional buying.
RSI Oversold
An RSI below 30 strengthens the reversal probability.
MACD Bullish Crossover
A bullish crossover after the pattern provides further confirmation.
Support Level
The pattern forms near:
- historical support
- Fibonacci retracement
- trendline support
- long-term moving averages
Trading Strategy
Conservative Entry
Wait until the next candle closes bullish.
Entry:
Above the confirmation candle.
Aggressive Entry
Enter immediately after Candle 4 closes.
Higher reward.
Higher risk.
Stop Loss
Common locations:
- Below Candle 4 low
- Below recent swing low
- Below nearby support
Profit Targets
Possible exit methods include:
Target 1
Previous resistance.
Target 2
50-day moving average.
Target 3
Risk-to-reward ratio of 2:1 or 3:1.
Target 4
Trail the stop using higher lows.
Strengths
Advantages include:
- Rare pattern with well-defined rules
- Identifies potential bearish exhaustion
- Useful after extended sell-offs
- Works well with momentum indicators
- Can signal early trend reversals
Weaknesses
Limitations include:
- Extremely rare
- Difficult to recognize correctly
- Requires strict confirmation
- Weak performance in sideways markets
- Can produce false signals during strong bear markets
Best Timeframes
The pattern tends to perform better on:
- Daily charts
- Weekly charts
- 4-hour charts
It is generally less reliable on very short-term charts (1-minute or 5-minute) because of market noise.
Combining with Other Indicators
The Concealing Baby Swallow becomes more reliable when combined with:
| Indicator | Purpose |
|---|---|
| RSI | Detect oversold conditions |
| MACD | Confirm momentum reversal |
| Volume | Identify institutional participation |
| Bollinger Bands | Spot price extremes |
| Fibonacci Retracement | Locate major support zones |
| Moving Averages | Confirm trend reversal |
| Stochastic Oscillator | Measure momentum exhaustion |
Common Mistakes
Many traders misuse this pattern by:
- Trading without an established downtrend.
- Ignoring confirmation from subsequent candles.
- Confusing it with other four-candle bearish continuation patterns.
- Entering before Candle 4 has fully closed.
- Ignoring overall market conditions.
- Neglecting risk management.
Practical Example
Suppose a stock has fallen for several weeks:
- Day 1: A long bearish candle confirms strong selling.
- Day 2: Another long bearish candle gaps lower with no upper shadow, signaling intensified bearish sentiment.
- Day 3: A small bearish candle forms entirely within the body of Day 2, indicating that downward momentum is slowing.
- Day 4: A long bearish candle engulfs the entire Day 3 candle, including its shadows, suggesting a final wave of capitulation.
- Day 5: A bullish candle closes above Day 4’s high with increased volume.
This sequence provides stronger evidence that sellers are exhausted and buyers may be taking control, making it a higher-probability bullish reversal setup.
Reliability
The Concealing Baby Swallow is generally considered a moderately reliable bullish reversal pattern when:
- It appears after a clear, extended downtrend.
- It forms near a significant support level.
- It is confirmed by a bullish follow-through candle.
- Momentum indicators show oversold conditions.
- Volume increases during or immediately after the reversal.
Because occurrences are infrequent, many traders may never encounter this pattern often in a single market. When it does appear under favorable conditions and with strong confirmation, it can provide an early indication that bearish pressure is fading.
Key Takeaways
- The Concealing Baby Swallow is a rare four-candle bullish reversal pattern.
- It develops only after a well-established downtrend.
- The first two candles demonstrate strong bearish momentum.
- The third “baby” candle reflects slowing downside momentum.
- The fourth candle engulfs the third, often marking seller capitulation.
- Confirmation from subsequent bullish price action is essential before entering a trade.
- The pattern is most effective when combined with volume analysis, RSI, MACD, and major support levels.
- Sound risk management and stop-loss placement remain critical, as no candlestick pattern guarantees a reversal.
Please check our Bullish Patterns Indicator collection.