The Hammer is one of the most recognizable and powerful single-candle reversal patterns in technical analysis. Found at the base of a markdown trend, it signals a definitive shift in market psychology: the transition from aggressive selling pressure to an influx of institutional buying demand.
Understanding the structural mechanics, order flow dynamics, and algorithmic validation of the Hammer pattern allows traders to effectively differentiate between a high-probability reversal and a minor structural pause.
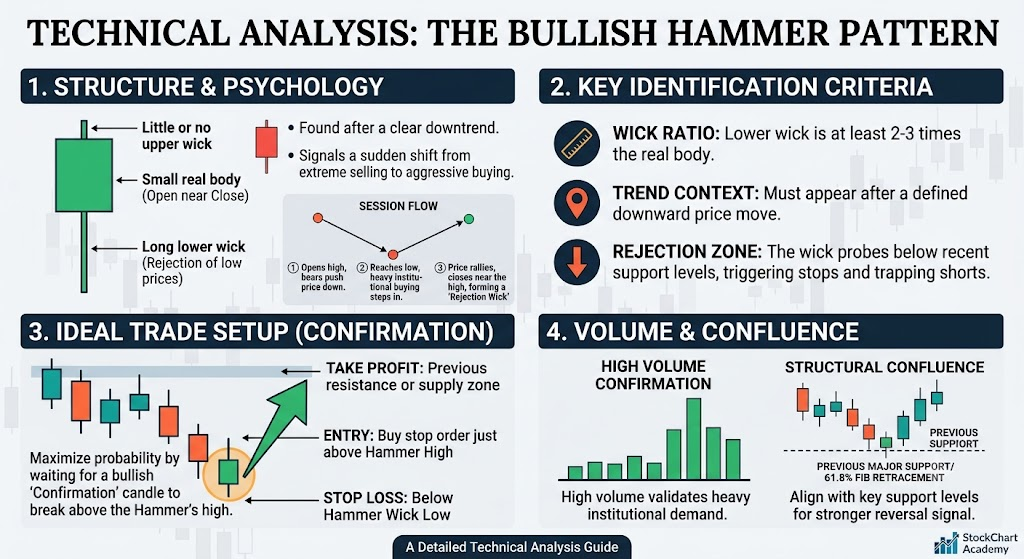
Structural Anatomy of a Hammer
A true Hammer candlestick is defined by rigid structural ratios. It consists of a small real body at the upper end of the price range, coupled with a significantly elongated lower shadow (wick).
To satisfy standard quantitative filtering, a Hammer must meet the following spatial criteria:
- Lower Shadow Ratio: The lower wick must be at least two to three times the height of the real body. This extensive wick visualizes the intra-session rejection of lower prices.
- Upper Shadow: The upper wick should be virtually non-existent or exceptionally small (typically less than 10% of the entire candle high-to-low range).
- Location: The pattern is context-dependent. It must occur after a defined downward structural move (lower lows and lower highs) to be classified as a Hammer.
Note on Candle Color: The real body can be either bullish (green/white) or bearish (red/black). However, a bullish body indicates a stronger reversal because it proves that buyers not only rejected the lows but also forced the close above the session’s opening print.
Market Psychology & Order Flow Dynamics
The formation of a Hammer tracks a specific battle between market participants over the course of a single session.
- The Bears Push: Upon the open, aggressive sellers drive the asset lower, breaking below prior support levels and trapping late-stage breakout shorts. This price action often triggers stop-loss orders from existing long positions, accelerating the descent.
- The Liquidity Pool: At the absolute lows of the candle, price enters an area of institutional demand or high-density buy limits.
- The Reversal: Large-scale buyers step in, absorbing the selling volume and initiating an aggressive counter-offensive. The sudden lack of selling pressure combined with short-covering forces a rapid retracement back toward the top of the session’s range.
This rapid recovery leaves behind the signature long lower wick, indicating a severe demand/supply imbalance where supply has been entirely exhausted.
Algorithmic Identification Criteria
When programming scanning software or automated trading strategies, relying purely on visual inspection is impossible. An indicator-based logic filter requires precise mathematical boundaries.
The standard mathematical model for a bullish Hammer is structured as follows:
$$Body = |Close – Open|$$
$$LowerShadow = \min(Open, Close) – Low$$
$$UpperShadow = High – \max(Open, Close)$$
$$TotalRange = High – Low$$
Quantitative Filtering Rules
To isolate a valid structural Hammer, code logic typically enforces three primary constraints:
- $LowerShadow \ge 2 \times Body$ (Ensures a significant wick ratio)
- $UpperShadow \le 0.10 \times TotalRange$ (Restricts upper extension)
- $TrendCondition = \text{True}$ (e.g., Price closes below a short-term Exponential Moving Average like the 20 EMA, or a structural Pivot High/Low series marks a sequence of lower lows).
Systematic Trading Strategies
Trading a raw Hammer in isolation introduces unnecessary risk. To maximize the expectancy of the setup, the pattern should be executed alongside volume analysis and strict structural confirmation.
1. The Confirmation Entry Strategy
Instead of entering immediately at the close of the Hammer candle, wait for market validation on the subsequent bar to prevent catching a falling knife.
- Entry: Place a buy stop order slightly above the high of the Hammer candle. Triggering this order proves ongoing bullish momentum.
- Stop-Loss: Position the invalidation invalidation level just below the lowest point of the Hammer’s lower wick. If price breaches this level, the structural demand area has failed.
- Take-Profit: Target the nearest major structural resistance or supply zone, aiming for a minimum risk-to-reward ratio of 1:2.
2. Volume & Confluence Validation
The statistical reliability of a Hammer increases significantly when paired with volume or structural confluence indicators:
| Technical Variable | High-Probability Characteristic | Market Meaning |
| Volume Profile | Above-average or expanding volume | Confirms heavy institutional accumulation at the lows. |
| Support Levels | Convergence with a major daily level, Weekly Pivot, or Golden Ratio Fibonacci retracement zone (61.8%). | Provides historical structural backing to the intra-day rejection. |
| Oscillators | Contextualized by an RSI or Stochastics reading below 30, or a multi-bar bullish divergence. | Suggests that selling exhaustion aligns with an extreme oversold state. |
Hammer vs. Hanging Man: The Crucial Structural Distinction
As illustrated in the structural diagram above, the Hammer shares an identical physical shape with the Hanging Man candlestick. The differentiation rests entirely on prior price context.
While a Hammer appears at the bottom of a clear downtrend and acts as a bullish reversal trigger, a Hanging Man forms at the peak of an extended uptrend. In that position, the long lower wick indicates that sellers are beginning to successfully break through the bulls’ defenses, serving as a bearish warning indicator. Always verify the prevailing macro structure before confirming the pattern’s directional bias.
Please check our Bullish Patterns Indicator collection.