The Upside Tasuki Gap is a relatively rare but highly reliable three-candle bullish continuation pattern. Found within strong, established uptrends, it signals a temporary structural pause where aggressive buyers step in to absorb profit-taking shorts.
Unlike reversal setups, the Upside Tasuki Gap proves that the prevailing market momentum is robust enough to easily defend an active gap window, marking it as a prime institutional-grade trend-continuation trigger.
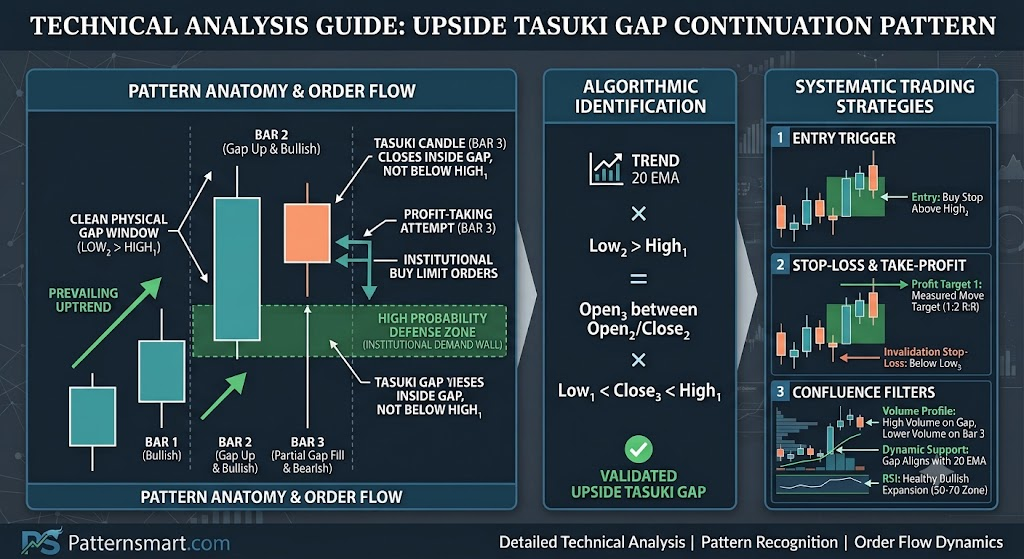
Structural Anatomy of the Pattern
The Upside Tasuki Gap is strictly defined by three distinct candlesticks and a specific spatial layout:
    [Bar 3: Bearish Red]
       +-+  <-- Closes inside the gap
       | |
       | |
       +-+
                   [Bar 2: Bullish Green]
                      +-+
                      | |
                      | |
                      +-+
  =================================  <-- Upper Gap Boundary
  =================================  <-- Lower Gap Boundary
[Bar 1: Bullish Green]
   +-+
   | |
   | |
   +-+
To satisfy standard quantitative filters, the pattern must adhere to the following strict criteria:
- Bar 1 (The Initial Drive): A strong, healthy bullish (green/white) candlestick that continues the existing upward trajectory.
- Bar 2 (The Gap Up): A second bullish candlestick that opens with a distinct, visible gap up above the close of Bar 1. The low of Bar 2 must remain completely above the high of Bar 1, leaving an unfilled price window.
- Bar 3 (The Tasuki Candle): A bearish (red/black) candlestick that opens within the real body of Bar 2 and closes lower. Crucially, Bar 3 must close inside the gap window but must not completely fill or close below the gap. The low of Bar 3 should remain above the close of Bar 1.
Market Psychology & Order Flow Dynamics
The mechanics of an Upside Tasuki Gap provide a clear window into institutional order flow and market sentiment:
- The Breakout (Bars 1 & 2): Strong buying pressure drives the asset upward, culminating in an overnight or intra-session liquidity gap. This gap is triggered by heavy institutional buying, catching late breakout traders off guard and forcing shorts to cover rapidly.
- The Profit-Taking Pause (Bar 3): After the sudden surge, shorter-term market participants begin taking profits, and counter-trend scalpers attempt to “trade the gap fill.” This creates a wave of selling pressure that pushes the price downward into the empty space left by the gap.
- The Demand Wall: As the price descends into the gap zone, it encounters a dense pool of unfilled institutional buy limit orders (often referred to as a “fair value gap” or liquidity pool). Because long-term buyers view this dip as a discount, the selling pressure is entirely absorbed before the gap can be closed.
The failure of the bears to close the gap indicates a severe lack of supply and absolute control by the bulls.
Algorithmic Identification Criteria
When writing scanning scripts or custom indicators (such as NinjaScript, cTrader C#, or Pine Script), the pattern requires rigid mathematical definitions to avoid false positives.
The core algorithmic filter can be structured using the following logical conditions:
$$Body_1 = Close_1 – Open_1 > 0$$
$$Body_2 = Close_2 – Open_2 > 0$$
$$Body_3 = Open_3 – Close_3 > 0$$
Quantitative Filtering Rules
To isolate a valid Upside Tasuki Gap, your code logic must enforce these conditions concurrently:
- Trend Context: $Close_1 > \text{EMA}(Close, 20)$ (Validates an active uptrend).
- The Gap: $Low_2 > High_1$ (Confirms a clean, physical gap window).
- Bar 3 Open: $Open_3 > Close_2 \text{ and } Open_3 < Open_2$ (Ensures Bar 3 opens within Bar 2’s real body).
- The Partial Fill: $Close_3 < Low_2 \text{ and } Close_3 > High_1$ (Guarantees that Bar 3 enters the gap but does not completely breach or close past the top of Bar 1).
Systematic Trading Strategies
Trading the Upside Tasuki Gap requires patience, as the true entry signal occurs only after the three-candle cluster fully resolves.
1. The Trigger Entry Strategy
Because the pattern is a continuation signal, traders look to capture the immediate resumption of the macro trend.
- Entry: Place a buy stop order slightly above the high of Bar 2. This ensures that you are only pulled into the trade when momentum shifts back to the upside and buyers break past the initial profit-taking peak.
- Stop-Loss: Position the invalidation level just below the low of Bar 1 or beneath the low of the counter-trend candle (Bar 3). If the price falls below the low of Bar 3 on subsequent bars, the gap defense has failed, invalidating the setup.
- Take-Profit: Use measured-move structures or trailing indicators (such as a multi-timeframe Super Trend or a trailing ATR-based stop) to maximize capture of the extended trend leg.
2. Confluence and Volume Filtering
| Technical Variable | High-Probability Characteristic | Market Meaning |
| Volume Distribution | High volume on Bars 1 & 2; lower/diminishing volume on Bar 3. | Proves that the drop on Bar 3 is merely low-liquidity profit-taking rather than aggressive institutional distribution. |
| Support Confluence | The gap window aligns with a major structural resistance-turned-support level or a dynamic moving average. | Increases the probability that the gap will act as an unbreakable floor. |
| Relative Strength Index (RSI) | RSI is in a healthy bullish expansion phase (e.g., oscillating between 50 and 70) without showing severe bearish divergence. | Confirms the underlying trend has ample velocity to continue upward. |
Key Pitfalls to Avoid
The most common mistake traders make when identifying this pattern is misinterpreting a true bearish reversal for a partial gap fill.
If the third candle features exceptionally high volume and closes completely below the high of Bar 1, the structural integrity of the gap is broken. In that scenario, the pattern transforms into a “Gap Fill and Reversal” setup, indicating that institutional demand has pulled away and a deeper market correction is underway. Always wait for the close of Bar 3 to confirm that the gap window has been successfully defended.
Please check our Bullish Patterns Indicator collection.