Auto Fibonacci retracement level indicator
The Auto Fibonacci Retracement Level Indicator is a valuable technical analysis tool traders use to identify support and resistance levels in a given financial market. The Fibonacci sequence, a mathematical pattern found in various natural phenomena, including stock market movements, serves as the foundation for the Auto Fibonacci Retracement Level Indicator.
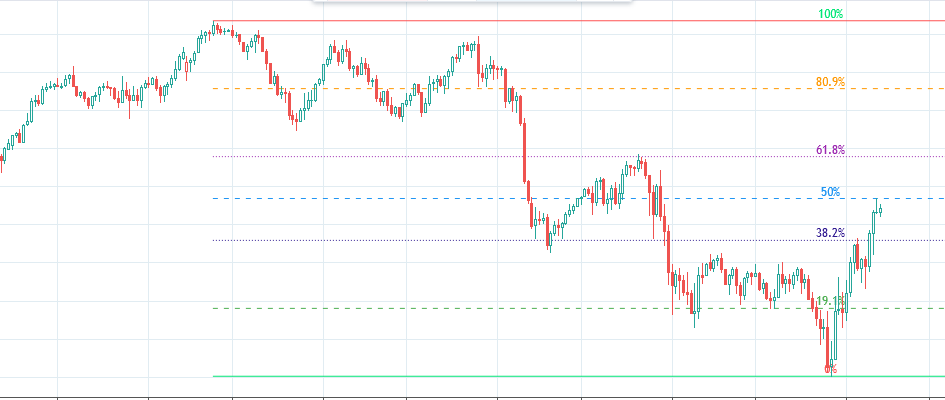
Fibonacci retracement levels are determined by measuring the distance between a significant high and low point in a market’s price movement and dividing that distance by the key Fibonacci ratios of 23.6%, 38.2%, 50%, 61.8%, and 100%.
The Auto Fibonacci Retracement Level Indicator automates this process by plotting the retracement levels on the chart automatically, making it easier for traders to identify potential areas of support and resistance quickly. Traders can also use it to confirm the direction of a trend. For example, if the retracement levels align with the overall trend, this can indicate that the trend is strong and likely to continue. Further, the Fibonacci levels can serve as a guide for setting stop-loss and profit-taking levels. For example, a stop-loss can be placed just below a key Fibonacci level to limit potential losses. Last but not least, traders can use the indicator to identify potential price targets. For instance, if the price breaks above a key Fibonacci level, this could indicate that the price may continue to rise toward the next Fibonacci level.
It is important to note that while the Fibonacci retracement level indicator can be a useful tool, it should not be relied upon exclusively when making trading decisions. Other technical and fundamental analysis tools, as well as market knowledge and experience, should also be used to help make informed trading decisions. Additionally, it is essential to remember that previous performance does not guarantee future outcomes and that the markets are inherently unpredictable.
In conclusion, the Auto Fibonacci Retracement Level Indicator can be used in various trading strategies, including swing trading, position trading, and day trading. Traders can leverage it to identify entry and exit points, manage risk, and determine the appropriate levels to place stop-loss orders. By utilizing this tool in combination with other technical analysis tools and market knowledge, traders may make more informed trading decisions and improve their chances of success.
For more details about this indicator, please visit patternsmart.com