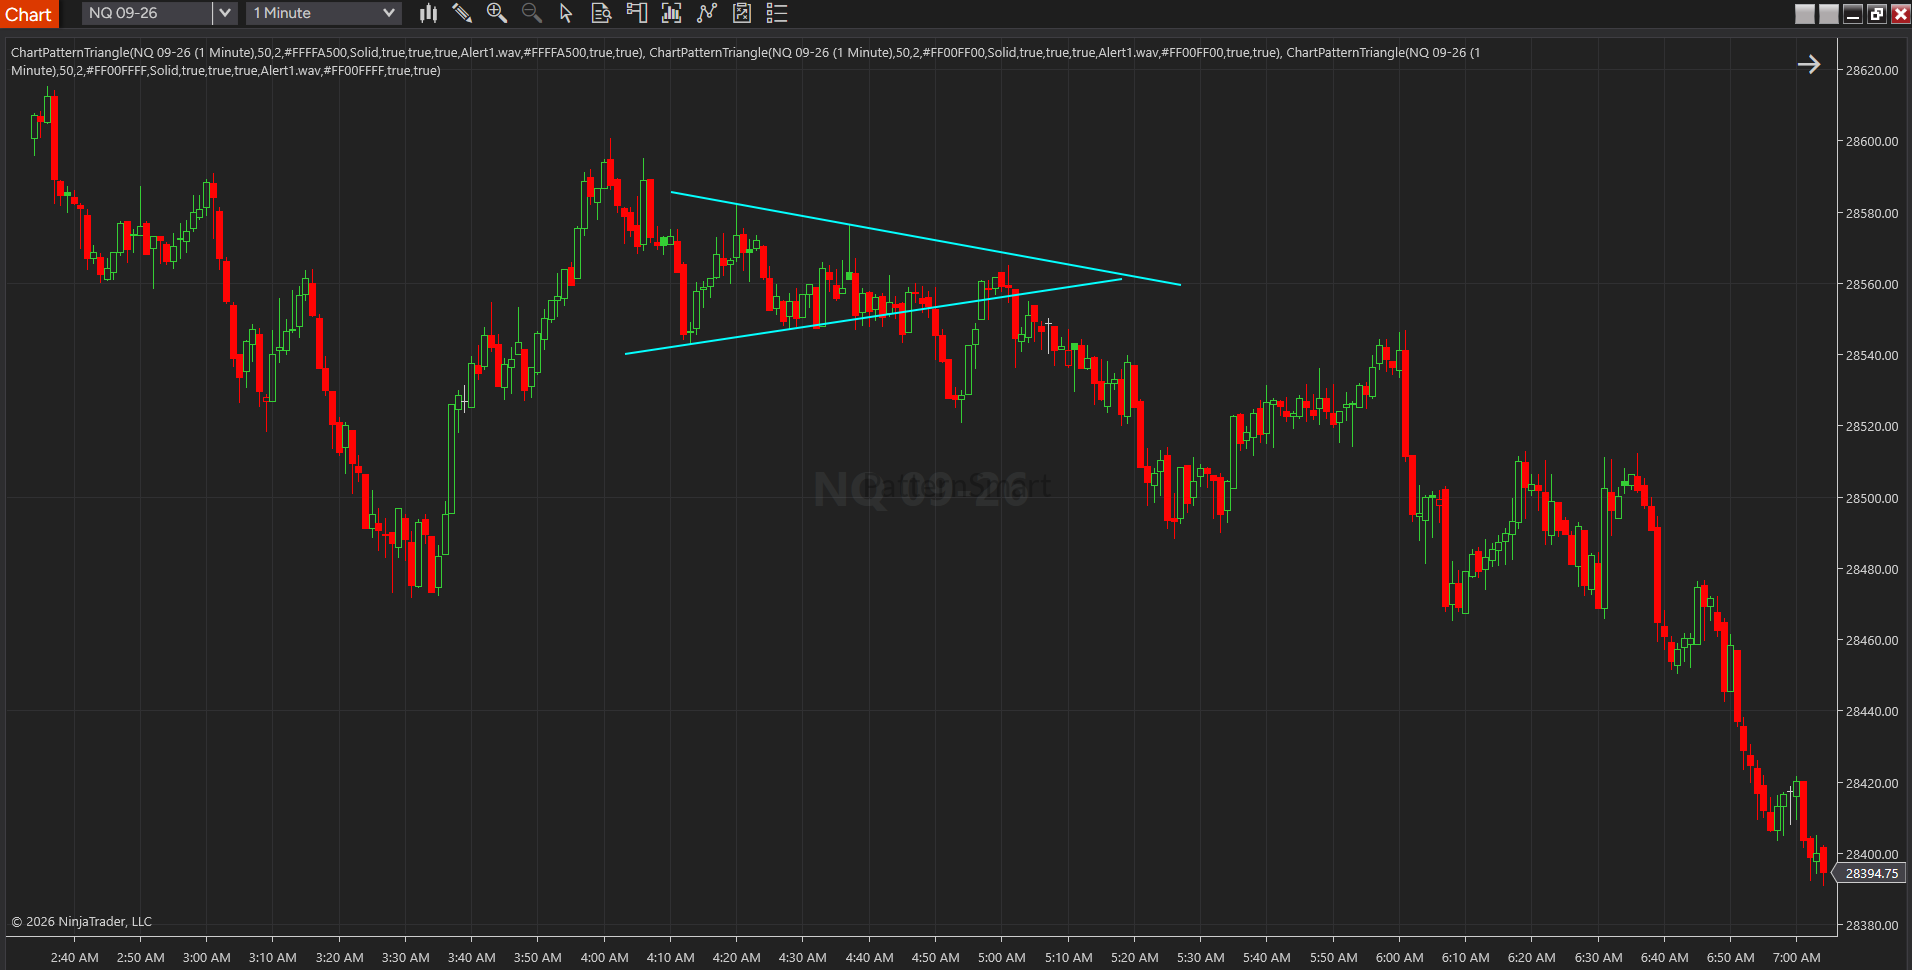
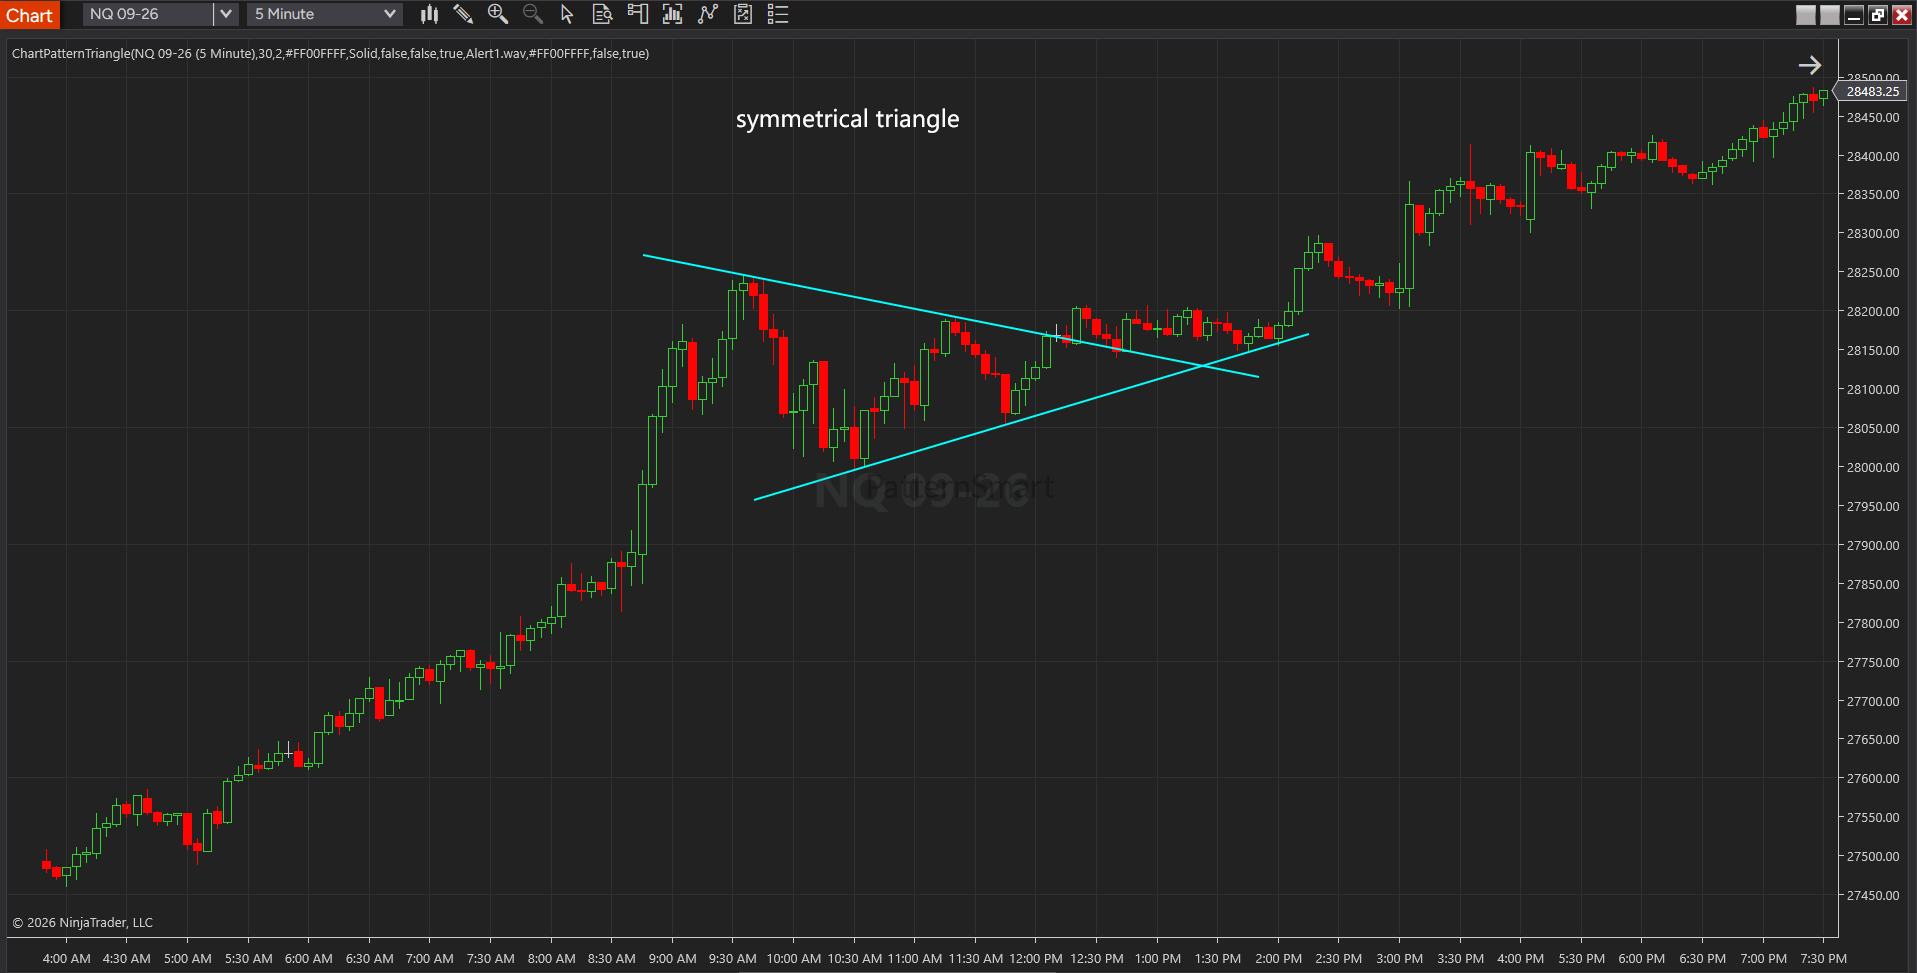
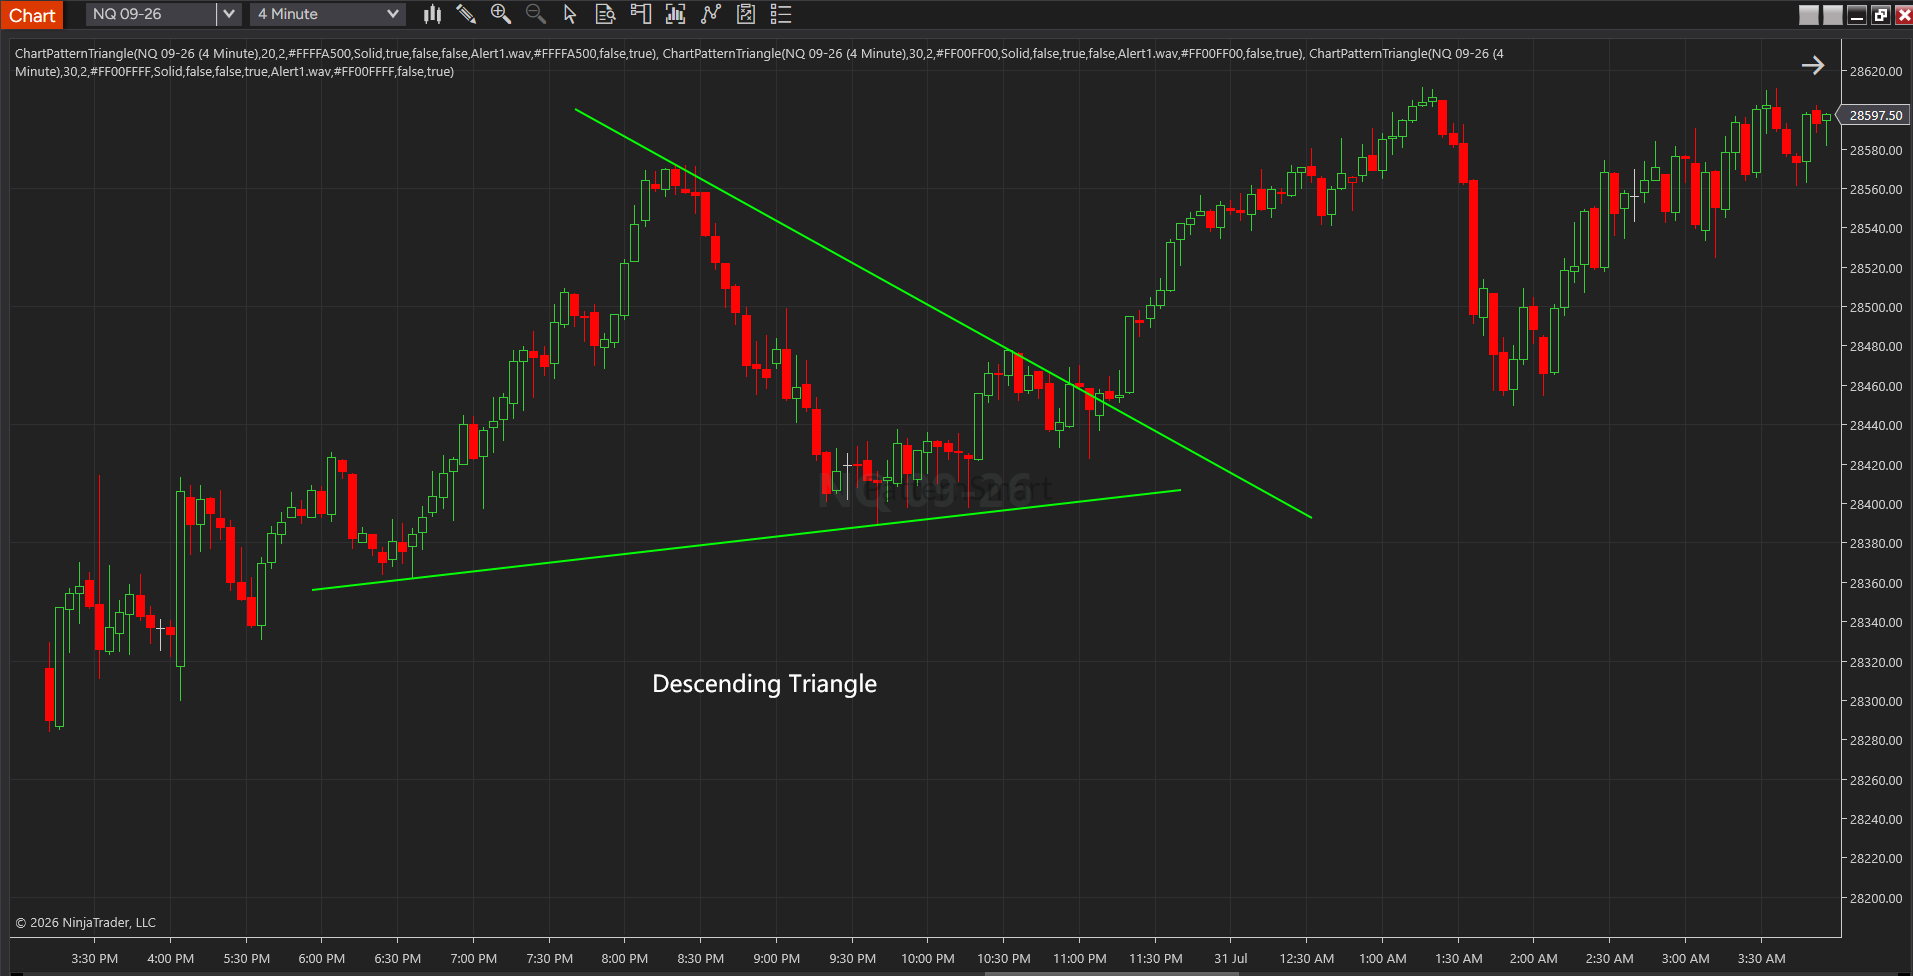
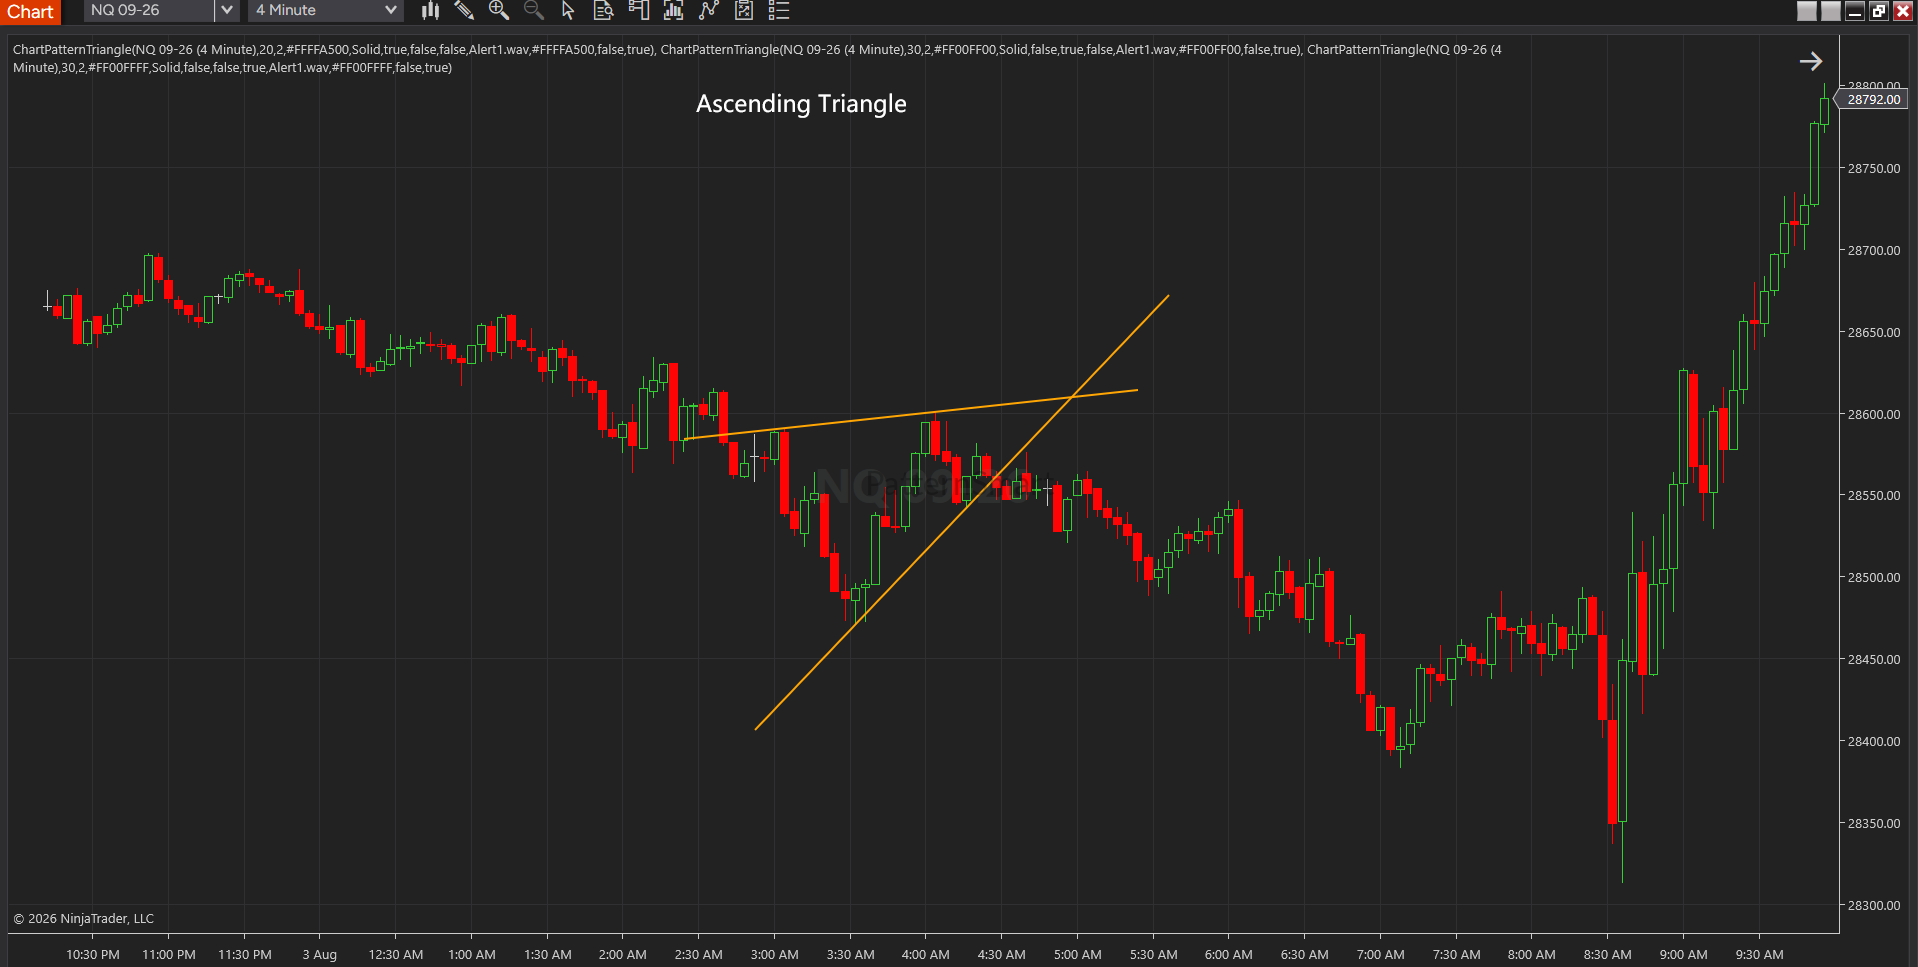
Product Overview
Identifying high-quality chart patterns consistently is one of the greatest challenges in technical analysis. While experienced traders may recognize triangle formations visually, manually scanning multiple markets and timeframes is both time-consuming and subjective. Small differences in interpretation often lead to inconsistent trading decisions, especially when market conditions change rapidly.
The Chart Pattern Triangle indicator for NinjaTrader 8 is designed to eliminate this uncertainty by automatically identifying completed triangle formations and displaying them directly on your charts. Instead of spending valuable time searching for potential setups, traders can focus on evaluating market conditions, planning entries, and managing risk with greater confidence.
The indicator continuously analyzes price action as new bars are completed and automatically highlights valid triangle structures with professionally drawn trend lines. Once a pattern is identified, optional audio alerts can immediately notify the trader, making it easy to monitor multiple instruments without constantly watching every chart.
Unlike many pattern recognition tools that focus on only one triangle variation, the Chart Pattern Triangle indicator supports the three most widely recognized triangle formations used in technical analysis:
- Ascending Triangle
- Descending Triangle
- Symmetrical Triangle
Each pattern type can be enabled or disabled independently, allowing traders to customize the indicator according to their preferred trading style and market conditions.
Why Triangle Patterns Matter
Triangle formations represent periods of temporary market balance where buying and selling pressure gradually converge before price eventually breaks away from the consolidation area. These structures are among the most widely recognized continuation and consolidation patterns in technical analysis, although they may also develop into reversal opportunities depending on the broader market context.
Because triangle patterns often precede significant price expansion, they are frequently used by traders to identify potential breakout opportunities, define logical support and resistance levels, estimate risk, and improve trade timing.
The Chart Pattern Triangle indicator helps simplify this analysis by automatically identifying these structures as they develop, allowing traders to spend less time drawing trend lines manually and more time evaluating trading opportunities.
Designed for Every Trading Style
Whether you are a discretionary trader or follow a structured trading plan, the Chart Pattern Triangle indicator integrates naturally into virtually any technical analysis workflow.
It can be used by:
- Scalpers seeking short-term breakout opportunities
- Day traders monitoring multiple markets simultaneously
- Swing traders looking for larger consolidation structures
- Position traders identifying higher-timeframe continuation patterns
- Technical analysts who prefer objective chart annotation
- Educators demonstrating classical chart patterns
- Traders developing rule-based trading methodologies
Because the indicator operates directly on the price chart, it provides immediate visual feedback without requiring additional indicator panels or complex configuration.
Flexible Across Markets and Timeframes
Financial markets rarely behave exactly the same way across different instruments. A pattern that develops on a stock chart may appear very differently on a futures contract, cryptocurrency, or Forex pair. For this reason, the Chart Pattern Triangle indicator is designed to work across virtually any liquid market supported by NinjaTrader 8.
Typical applications include:
- Futures
- Forex
- Stocks
- ETFs
- Cryptocurrencies
- Commodities
- Index CFDs
The indicator is equally suitable for multiple chart intervals, including intraday, daily, weekly, and higher timeframes.
It can also be applied to many popular chart types available within NinjaTrader, allowing traders to incorporate automatic triangle recognition into their preferred charting environment.
Intelligent Pattern Visualization
A chart pattern is only useful if it can be interpreted quickly.
Once a triangle is detected, the indicator automatically draws clean upper and lower boundary lines, creating a clear visual representation of the pattern without cluttering the chart. Users can customize the appearance of these lines, including colors, line styles, thickness, and extension length, ensuring the indicator integrates seamlessly with any chart template.
For traders who prefer a cleaner workspace, an option is available to display only the most recently detected pattern while automatically removing older drawings. Others may choose to keep historical patterns visible for chart review and post-trade analysis.
Built for Real-Time Market Analysis
The Chart Pattern Triangle indicator is designed to operate during live market conditions as well as historical chart analysis.
As new price bars become available, the indicator continuously evaluates market structure and automatically displays newly completed triangle formations whenever qualifying patterns are identified. Optional sound alerts help ensure that traders never miss important developments, even while monitoring numerous instruments simultaneously.
This makes the indicator equally useful for:
- Live trading
- Market scanning
- End-of-day analysis
- Trade preparation
- Educational review
- Historical chart studies
Customizable to Match Your Workflow
Every trader analyzes markets differently. Rather than forcing a single configuration, the Chart Pattern Triangle indicator provides flexible customization options that allow users to tailor the display according to their individual preferences.
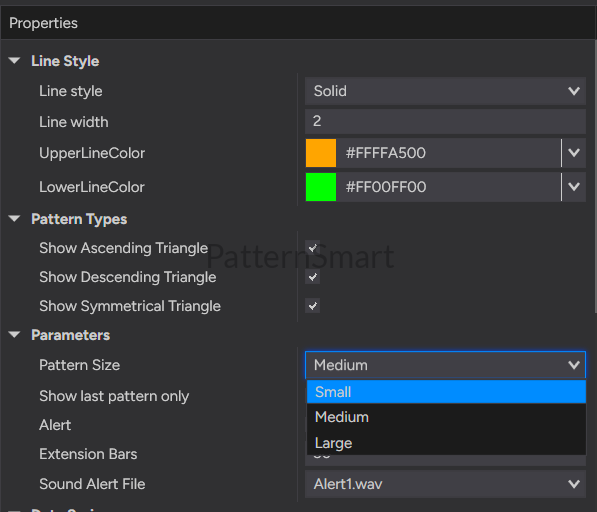
Available customization includes:
- Pattern size selection
- Individual triangle type selection
- Audio alerts
- Alert sound selection
- Trend line extension length
- Line style
- Line width
- Upper trend line color
- Lower trend line color
- Display of only the latest detected pattern
These options allow traders to adapt the indicator for fast-moving intraday charts, higher-timeframe swing analysis, or virtually any trading methodology.
Key Features
- Automatically detects completed triangle formations
- Supports Ascending, Descending, and Symmetrical Triangles
- Draws professional upper and lower trend lines automatically
- Optional forward extension of triangle boundaries
- Configurable pattern size for different trading styles
- Independent enable/disable controls for each triangle type
- Optional sound alerts for newly detected patterns
- Fully customizable line colors, styles, and widths
- Option to display only the latest detected pattern
- Suitable for discretionary and systematic traders
- Compatible with all major financial markets supported by NinjaTrader 8
- Designed for both historical analysis and real-time market monitoring
A Practical Tool for Modern Technical Analysis
The Chart Pattern Triangle indicator is designed to make classical chart pattern recognition faster, more objective, and easier to integrate into everyday trading.
Instead of manually searching through charts and drawing trend lines by hand, traders receive clear visual identification of completed triangle formations directly on the chart. This streamlined workflow helps improve consistency, saves analysis time, and allows greater focus on trade planning and execution.
Whether your goal is identifying breakout opportunities, monitoring consolidations, or enhancing your overall technical analysis process, the Chart Pattern Triangle indicator provides a clean, efficient, and highly customizable solution for incorporating one of the market’s most important chart patterns into your trading routine.
The Triangle Chart pattern indicator is available in these platforms: Ctrader, MetaTrader(MT4, MT5), NinjaTrader 8, MultiCharts, MultiCharts x.NET, Tradingview, Prorealtime, SierraChart.