The Bearish Flag is one of the most recognizable continuation patterns in technical analysis. It represents a temporary pause after a strong decline, where buyers attempt to reverse the trend but fail to generate enough momentum. Once selling pressure resumes, price often continues in the direction of the original downtrend.
However, like every chart pattern, a Bearish Flag should never be interpreted as a guaranteed continuation signal. It is a probabilistic pattern that reflects the ongoing battle between buyers and sellers. Sometimes the bears regain control quickly, while other times the attempted continuation fails, leading to trend reversal or prolonged consolidation.
The following examples were automatically detected using the Bearish Flag Chart Pattern Indicator. Together, they demonstrate both successful bearish continuations and an example of a failed continuation, highlighting why traders should wait for confirmation instead of assuming every Bearish Flag will produce another decline.
Understanding the Structure of a Bearish Flag
A classic Bearish Flag consists of three phases:
Phase 1 – The Flagpole
The pattern begins with an aggressive decline.
Characteristics include:
- Strong bearish momentum
- Consecutive bearish candles
- Limited pullbacks
- Sellers clearly dominate buyers
This initial selloff forms the flagpole, which represents institutional selling pressure entering the market.
Phase 2 – The Flag
After the sharp decline, selling pressure temporarily weakens.
Instead of continuing lower immediately, price begins to recover in a relatively orderly manner.
Typical characteristics include:
- Higher highs and higher lows
- Small bullish candles
- Slower momentum
- Rising parallel trendlines
This upward movement creates the flag, which is essentially a counter-trend correction rather than the start of a new uptrend.
The key idea is that buyers are attempting to push prices higher, but their buying strength remains weaker than the earlier selling pressure.
Phase 3 – Continuation
The pattern completes when sellers regain control.
Confirmation generally occurs when price breaks below the lower boundary of the flag.
Once this happens:
- bearish momentum often accelerates,
- trapped buyers begin exiting,
- new short sellers enter,
- the original trend resumes.
Example 1 – A Textbook Bearish Continuation
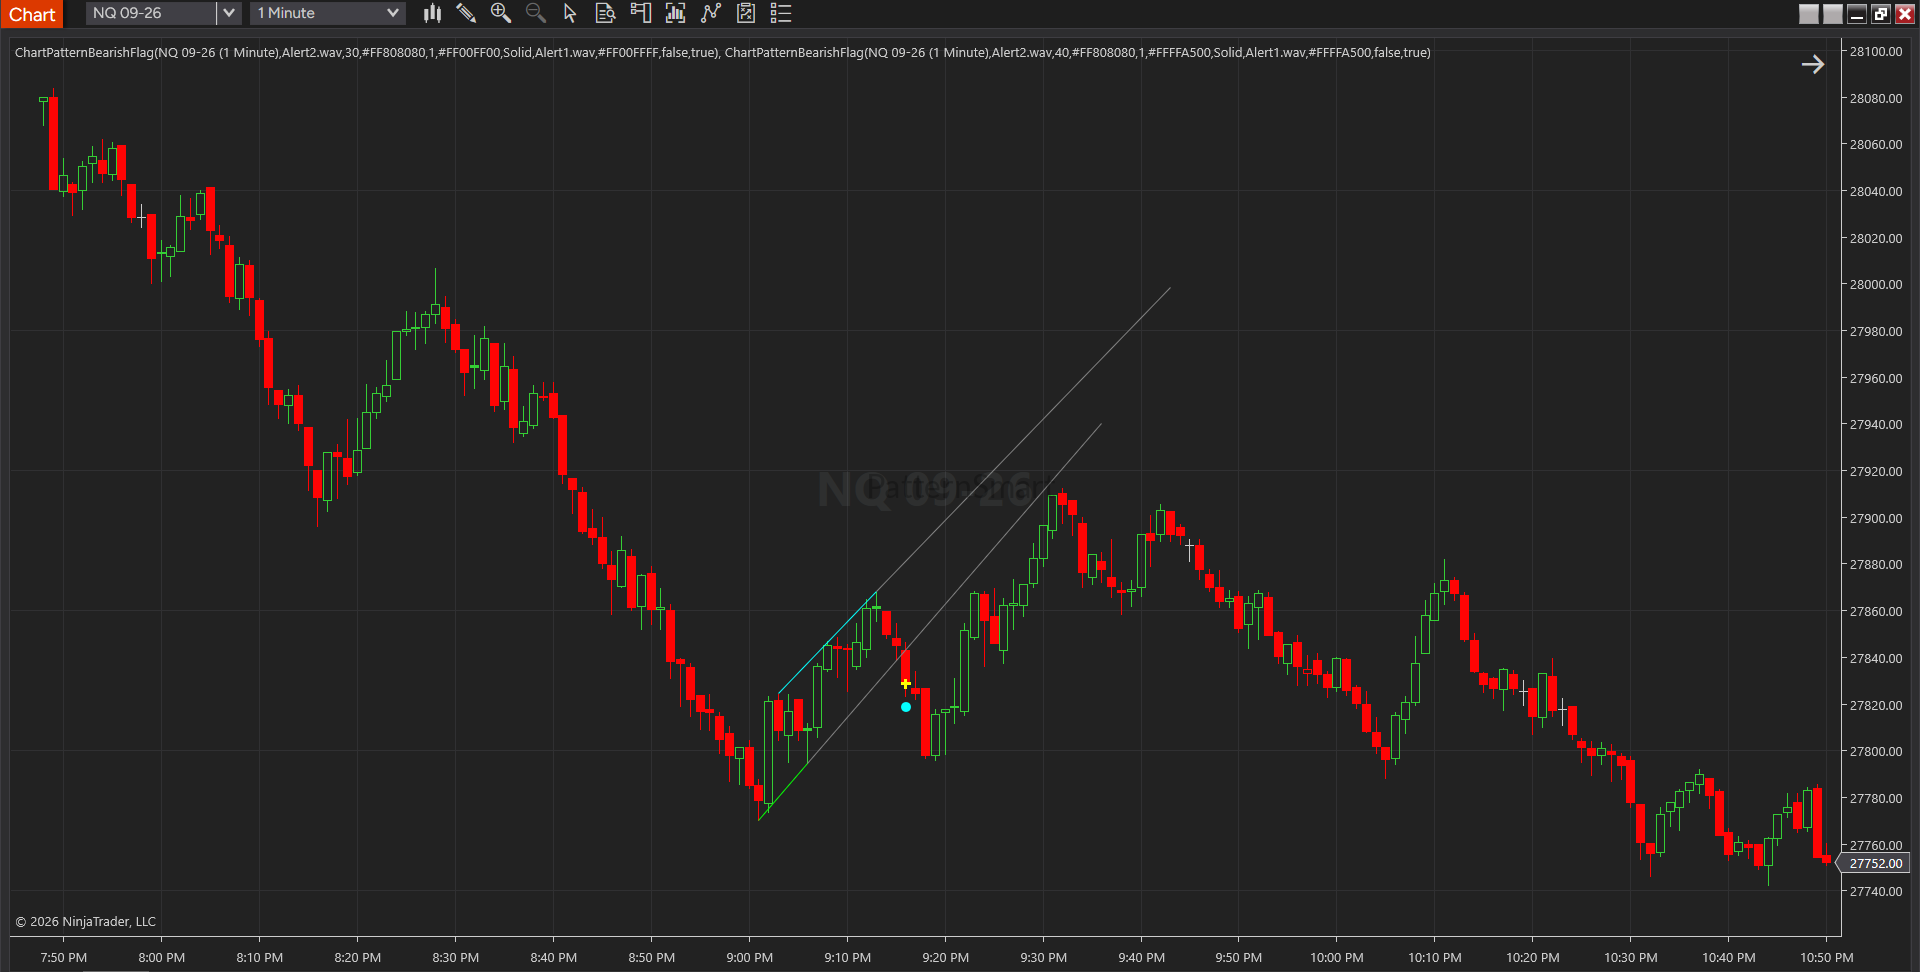
The first chart demonstrates a classic Bearish Flag.
Following a strong selloff, price begins to retrace upward within a relatively narrow rising channel.
Several observations stand out:
- The pullback is significantly smaller than the initial decline.
- Buying momentum appears controlled rather than aggressive.
- Price remains contained inside the rising flag.
- Sellers return before buyers can establish a larger reversal.
Eventually, price breaks beneath the lower trendline, confirming the Bearish Flag.
After the breakdown, the market resumes the original downtrend and continues making lower lows.
This is exactly the type of behavior continuation traders look for.
The pattern acts as a temporary pause rather than a trend reversal.
Example 2 – Another Successful Bearish Flag
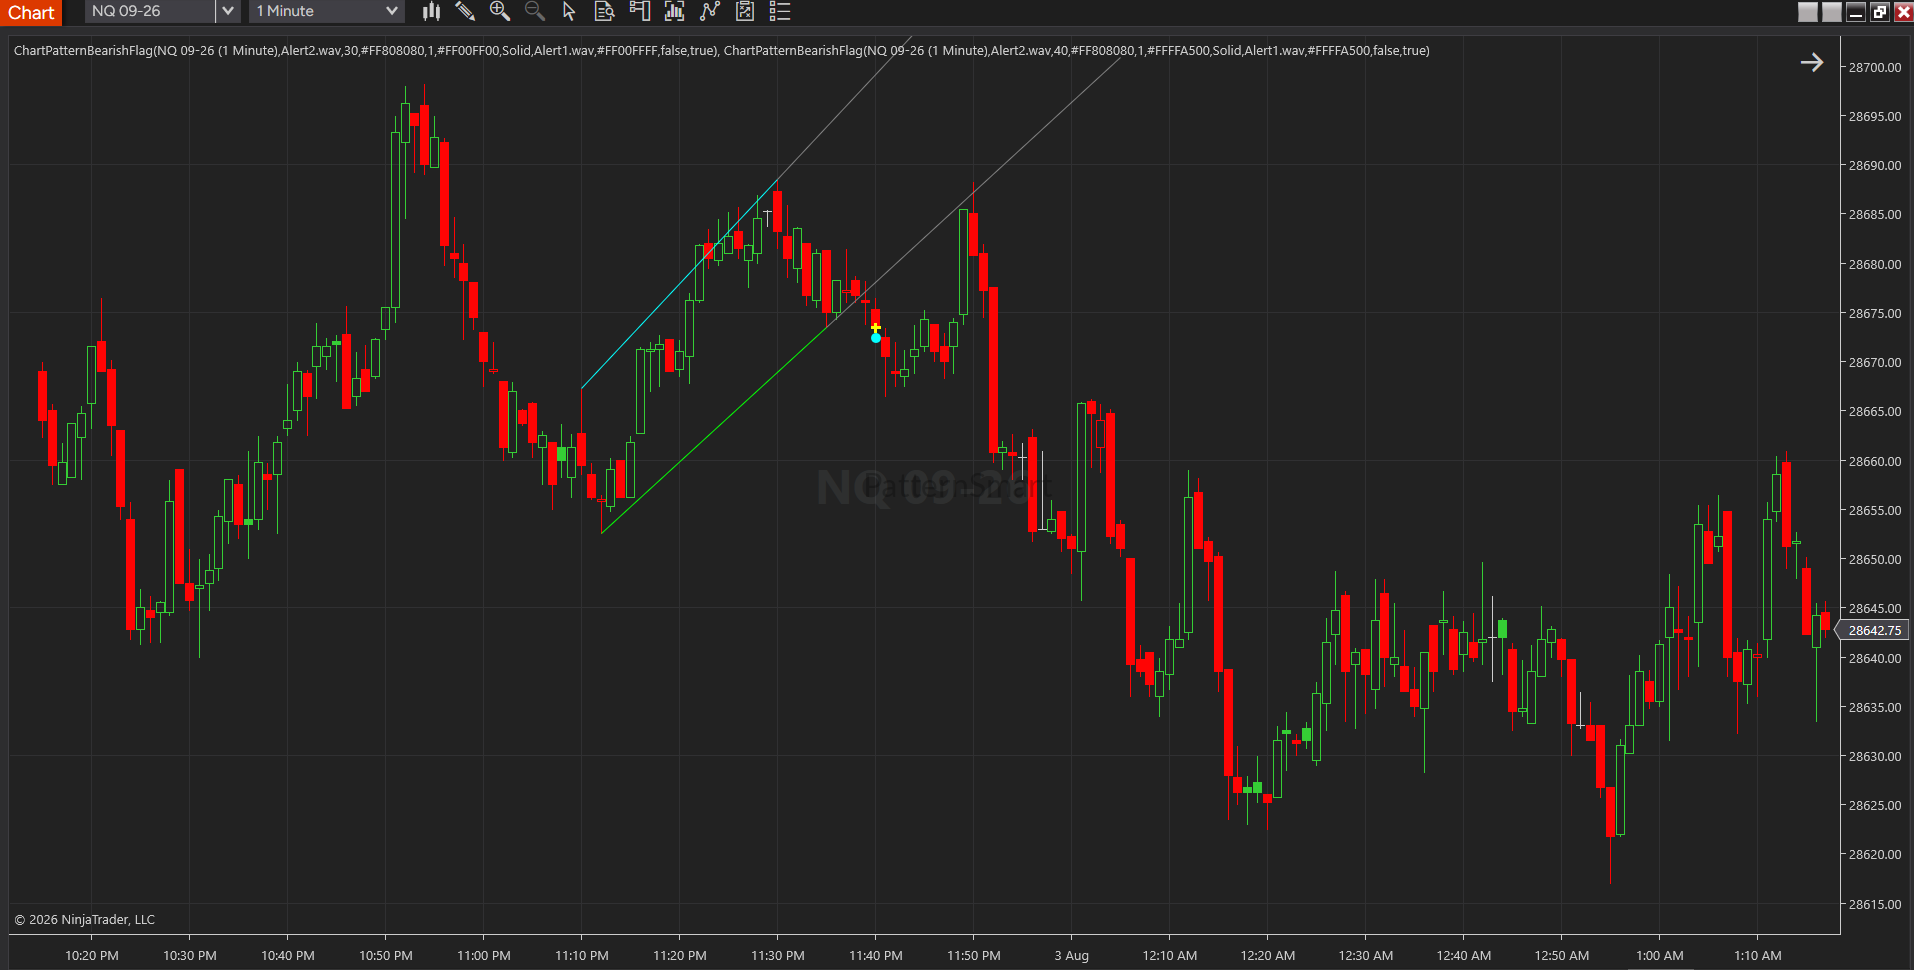
The second chart presents another Bearish Flag with similar characteristics.
Again, the market experiences:
- a sharp bearish impulse,
- followed by a gradual upward retracement,
- contained within rising trendlines.
Although buyers manage to push prices higher for a short period, the recovery lacks sufficient momentum to overcome the dominant bearish trend.
Once the lower boundary of the flag fails, sellers quickly regain control.
The subsequent decline confirms that the pullback was merely a temporary correction.
Notice that the continuation occurs shortly after the breakout instead of spending excessive time inside the pattern.
This relatively quick transition from consolidation back into trending behavior is often seen in strong Bearish Flag setups.
Example 3 – When the Bearish Flag Fails
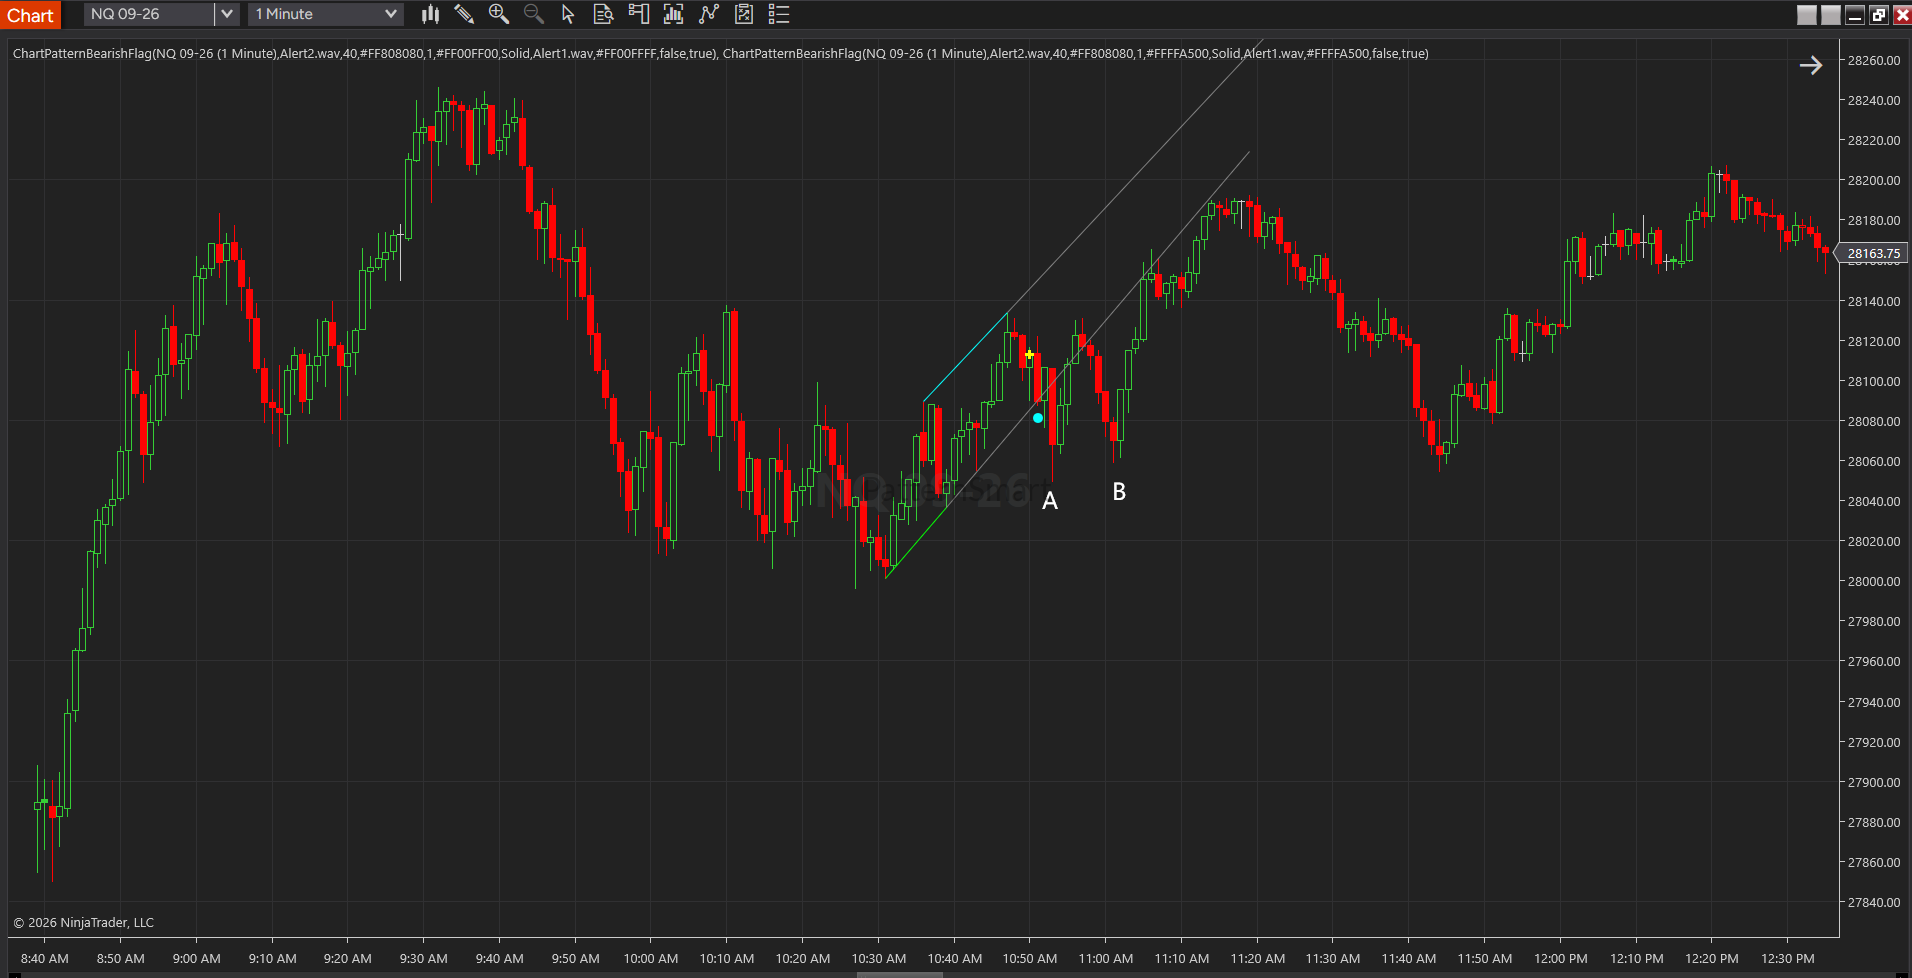
The third chart illustrates an equally important lesson:
Not every Bearish Flag results in continuation.
Initially, the market forms what appears to be a valid Bearish Flag.
The structure resembles the previous examples:
- strong preceding decline,
- orderly upward retracement,
- rising flag boundaries.
Afterward, price attempts to move lower.
Two notable bearish attempts occur at Point A and Point B.
At both locations:
- sellers attempt to resume the original downtrend,
- bearish momentum briefly increases,
- continuation appears possible.
However, neither attempt succeeds.
Instead of producing new lower lows, selling pressure quickly fades.
Buyers repeatedly absorb the decline and prevent the breakdown from developing into a sustained trend.
Eventually:
- price stabilizes,
- bullish participation increases,
- the market transitions into an upward move instead of continuing lower.
This is a classic example of a failed Bearish Flag.
The pattern itself was valid, but the market simply did not provide sufficient bearish follow-through.
This reinforces an important principle:
A chart pattern identifies a potential opportunity—not a guaranteed outcome.
Confirmation always comes from price action after the pattern forms.
Why Bearish Flags Sometimes Fail
Several factors can prevent continuation.
1. Buyers absorb selling pressure
Repeated buying near support prevents sellers from extending the decline.
Although bears initiate the breakdown, they fail to generate enough momentum.
2. Selling momentum weakens
The initial flagpole may have exhausted most of the available sellers.
Without additional participation, continuation becomes increasingly difficult.
3. Higher timeframe support
A Bearish Flag occurring directly above major support may encounter significant buying interest.
Even a technically correct pattern can fail when higher timeframe buyers step in.
4. Trend transition
Sometimes the market is already shifting from a bearish environment toward accumulation.
In these situations, continuation patterns become less reliable because the dominant trend is changing.
Waiting for Confirmation
A common mistake is entering immediately after identifying the flag.
Professional traders generally wait for evidence that sellers have actually regained control.
Typical confirmation methods include:
- Break below the lower flag boundary.
- Strong bearish closing candle.
- Expansion in bearish momentum.
- Break below recent swing lows.
- Increased selling volume (when volume data is available).
Waiting for confirmation reduces the number of false continuation trades.
Risk Management Matters
Even well-formed Bearish Flags occasionally fail.
Because of this, risk management remains essential.
Many traders:
- place protective stops above the upper boundary of the flag,
- size positions appropriately,
- avoid assuming every detected pattern will produce a large continuation.
Successful trading depends not on predicting every outcome correctly, but on managing uncertainty consistently.
The Value of Automatic Pattern Detection
Identifying Bearish Flags manually can be subjective, particularly during fast-moving markets.
The Bearish Flag Chart Pattern Indicator automates this process by scanning price action and detecting flag structures based on predefined geometric conditions.
Rather than searching visually through hundreds of charts, traders can quickly locate potential continuation setups and then evaluate them within the broader market context.
Importantly, the indicator highlights potential trading opportunities, not guaranteed trade signals. The first two examples demonstrate how a Bearish Flag can precede a strong continuation when sellers successfully regain control. The third example is equally valuable because it shows that even a well-formed pattern may fail if bearish follow-through never materializes.
This balanced perspective helps traders use Bearish Flags as part of a disciplined decision-making process rather than relying on pattern recognition alone.
Conclusion
The Bearish Flag is one of the most effective continuation patterns because it captures a common market behavior: a temporary counter-trend rally within a larger downtrend. When sellers reassert control, the pattern often leads to another significant decline.
At the same time, the third example demonstrates an equally important reality: a valid pattern does not guarantee a valid outcome. Even after multiple bearish attempts at Point A and Point B, the market refused to generate sustained selling pressure and ultimately moved higher instead.
For this reason, Bearish Flags should always be interpreted as high-probability continuation opportunities rather than certainty. Combining automatic pattern detection with confirmation from price action, momentum, support and resistance, and sound risk management provides a far more robust trading approach than relying on the pattern alone. By studying both successful continuations and failed setups, traders gain a deeper understanding of how market structure evolves—and why confirmation is always more important than expectation.