The NT8 version will include chart indicator and Market Analyzer.
Support & Resistance Level and Supply & Demand Zone are very common and popular jargon in technical analysis.
What is the difference between Support & Resistance Level and Supply & Demand Zone?
In my opinion, Support & Resistance Level is the value of price that tested couple times and hard to break. The zone is formed by two adjacent levels where price may oscillate between those two levels.
Imagine the levels as horizontal lines, and the zones are areas between two horizontal lines.
Why are they important?
In a nutshell, they indicate where the price direction may reverse so you can act accordingly.
There are a couple methods to draw the Support & Resistance Level and Supply & Demand Zone, In most case, people will use swing high or low, or pivot points as the level. But there are too many of them, and not all pivot points will become Support & Resistance Level.
Some of the support or resistance level is hard to break, but after the price break through that level, resistance will become support and vice versa, I define it as Critical Level.
If you draw a critical support or resistance level from the current bar and move backward to where it started, you will notice that some levels are formed by the pivot points from hundreds of bars ago. It’s impossible to discover the Critical Levels if you don’t have enough bars loaded on chart.
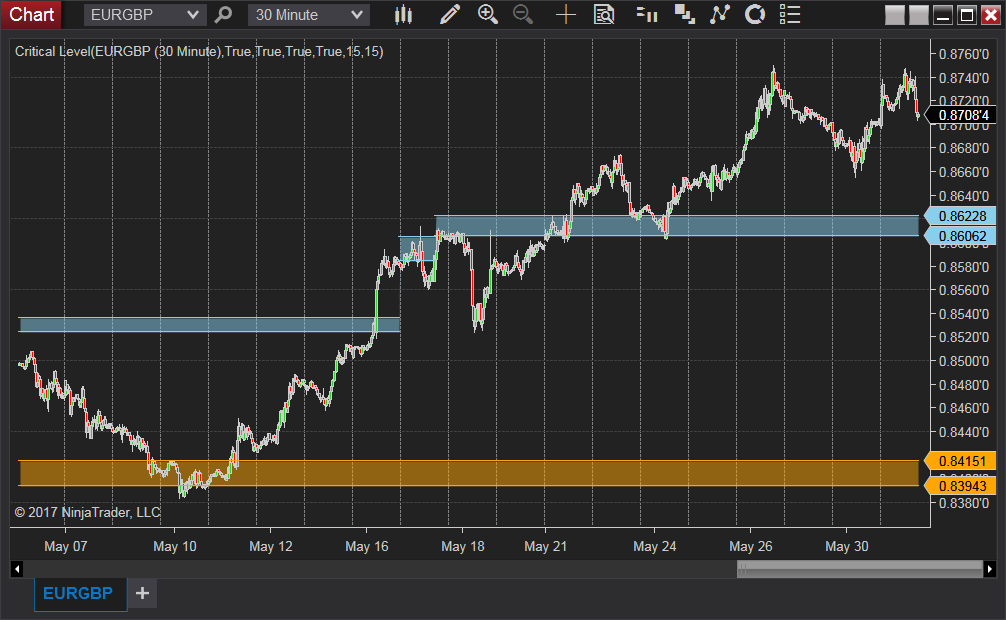
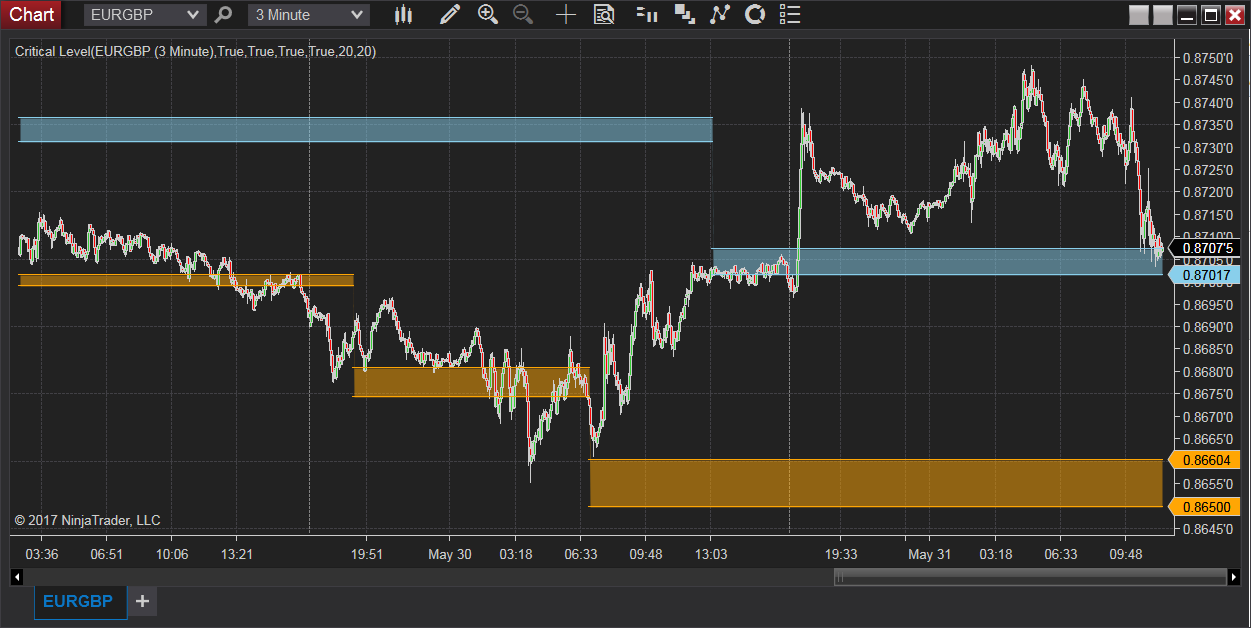
The purpose of this indicator is to plot critical support and resistance level automatically on chart.
It will work on all market, Stock, Forex and Futures. It also works on all timeframes.
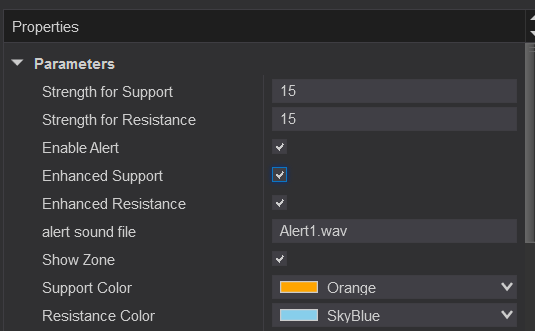
Inputs:
- The Strength inputs control the intensity of Support & Resistance Level.
- The Alert input is the switch of alert function.
- By enable Enhanced mode, the indicator will be more critical.
- Check Showzone input to plot colored zones.


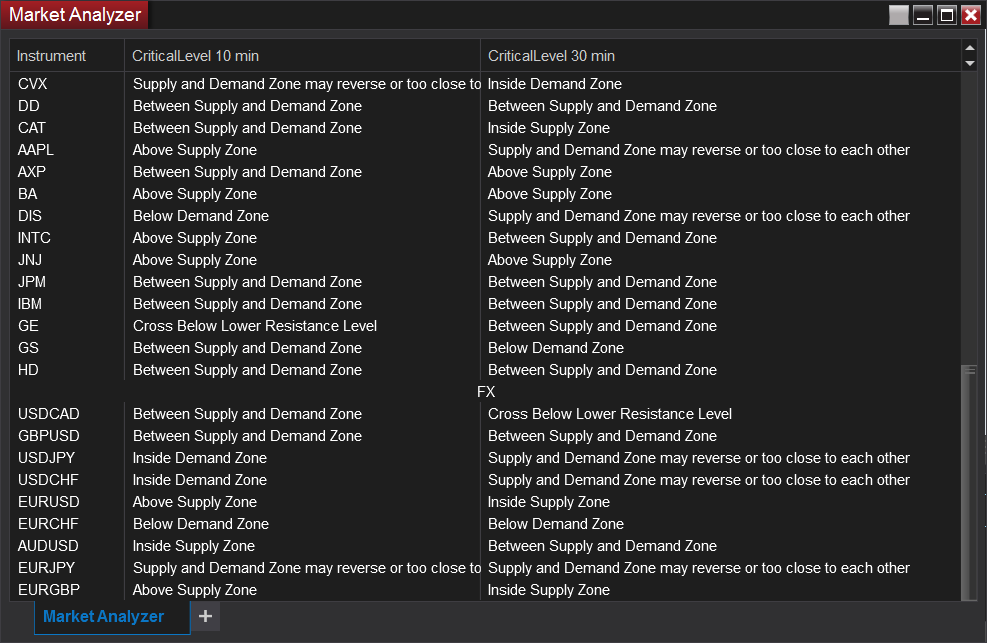
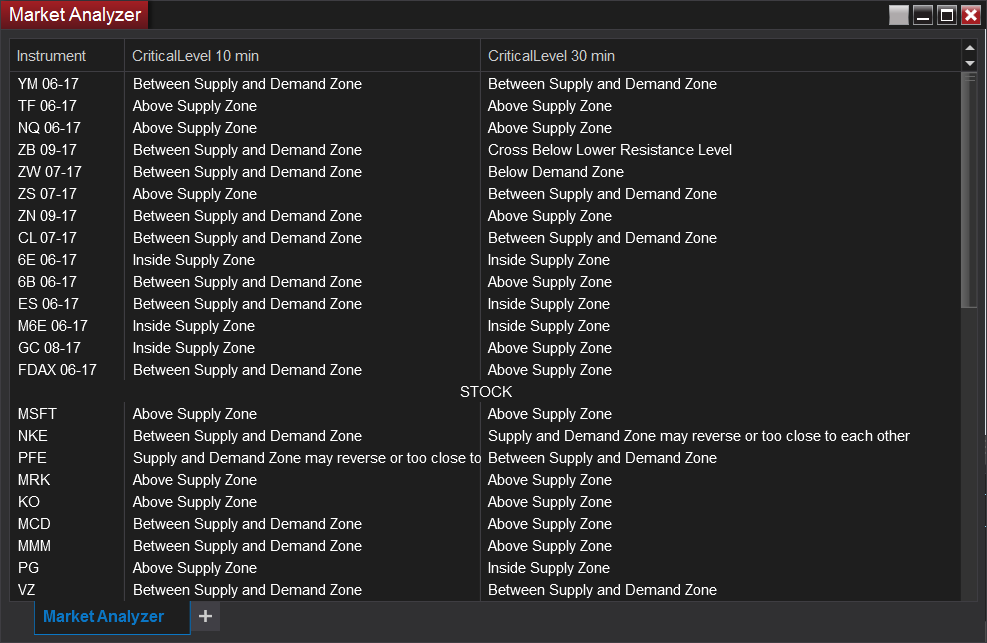
The Market Analyzer Columns will list the following conditions between current Close and the indicator’s values:
“Above Supply Zone”;
“Below Demand Zone”;
“Inside Demand Zone”;
“Inside Supply Zone”;
“Cross above Upper Support Level”;
“Cross above Lower Support Level”;
“Cross Below Upper Support Level”;
“Cross Below Lower Support Level”;
“Cross above Upper Resistance Level”;
“Cross above Lower Resistance Level”;
“Cross Below Upper Resistance Level”;
“Cross Below Lower Resistance Level”;
“Between Supply and Demand Zone”;
“Supply and Demand Zone may reverse or too close to each other”;
After import the file CriticalLevelMAC.zip, you will be able to see it under the MarketAnalyzerColumn list as shown in below:

You can add the Market Analyzer Column more than once with different timeframe and different inputs.
Hi,
Can you please provide a trial version of this indicator?
Regards,
Ajay
Please check https://www.patternsmart.com/cart/index.php?route=information/information&information_id=29