Please note that this purchase is a 1-Year license. About License renew.
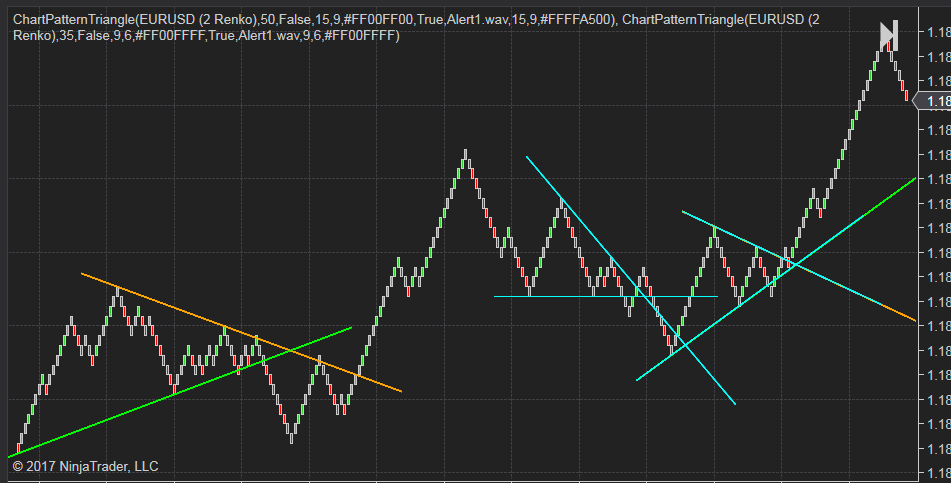
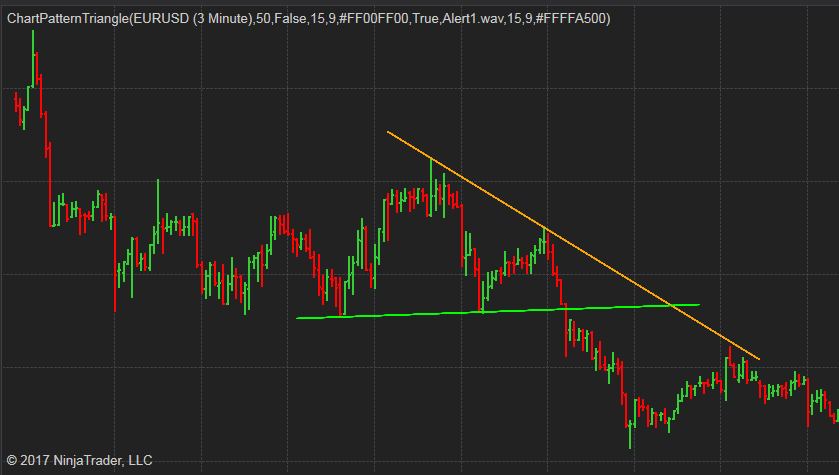
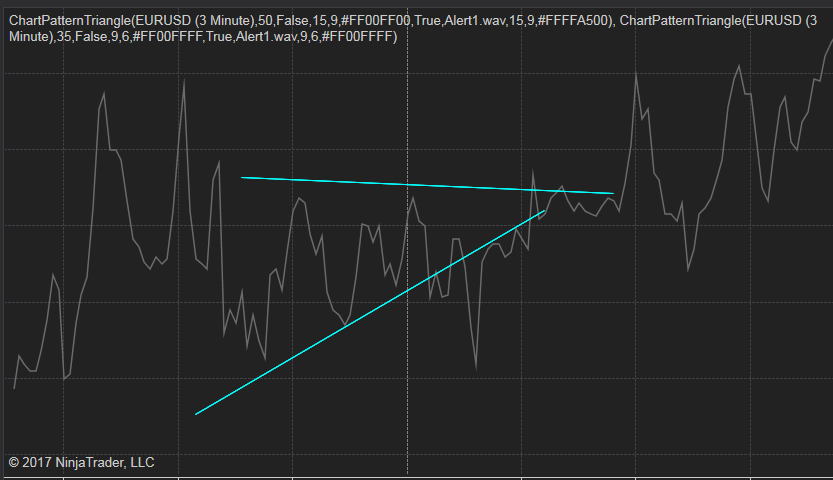
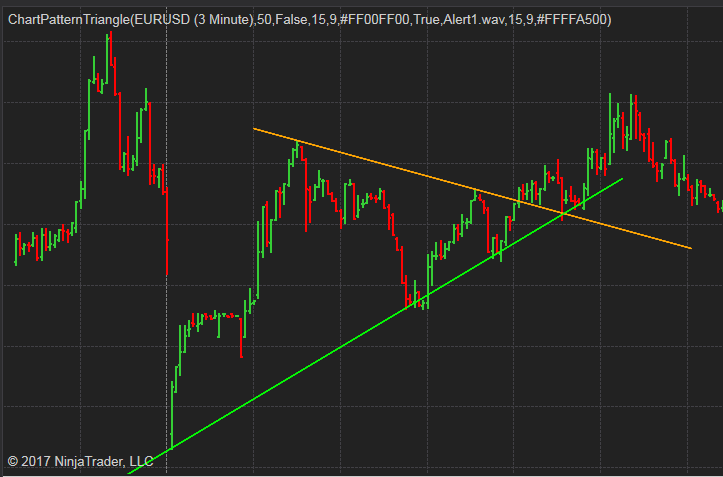
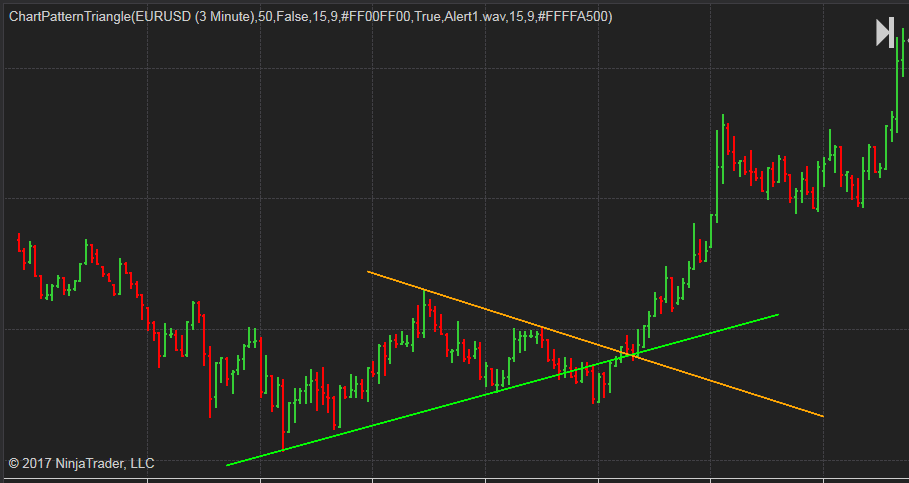
This indicator will automatically detect all three types of triangle chart patterns, the symmetrical triangle, the descending triangle and the ascending triangle.
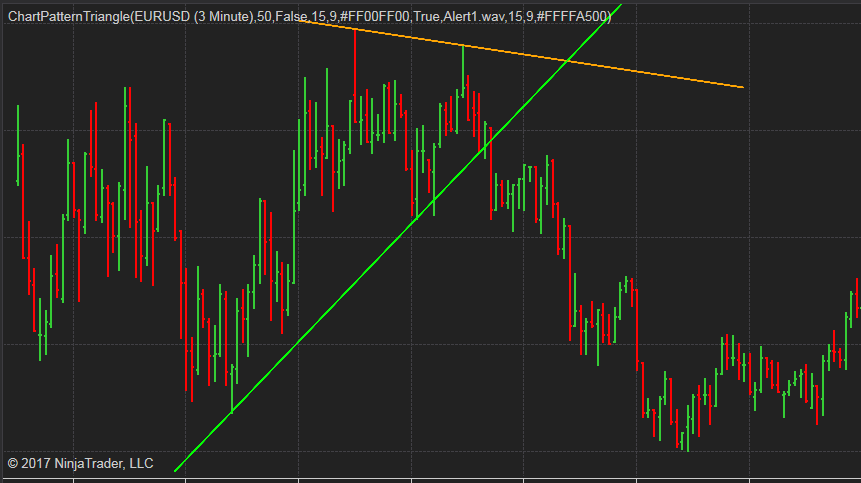
It will draw two trend lines of the triangle on the chart when the pattern is formed.
Features:
- Drawing Triangle chart pattern for both realtime and historical data.
- Adjustable length of pattern legs.
- Using different combination of parameters, you can easily identify the Triangle pattern in short term, midterm and long term.
- It works on most of the time frames and chart types, including: minutes, daily, weekly, monthly, tick, renko, range, Heiken Ashi, etc.
- It works on all markets and symbols.
- Adjustable length of extension lines.
- Switch for showing the latest pattern only or show all history patterns found on chart.
- Select different sound alert files with switch.
- Editable trend line color.
- Show Fibonacci retracement automatically.
There is a plot that can be used from other NinjaScript, such as Strategy and Market Analyzer.
They will show up on current bar, no delay, no repaint or back-paint.
In default, the color is transparent, if you need to see the plots on the chart, just change its color to your desired ones.
This video shows how it works in real time.
.png)

The following image shows how alert works, whenever a Triangle pattern is detected you should be able to hear the alert sound. If the Alert log window is opened you can also see the alert message listed there.

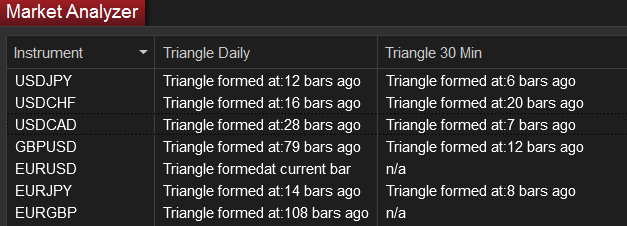
It also comes with a standalone Market Analyzer script.
This Market Analyzer script is able to show when the latest Triangle Chart pattern formed within a given range.
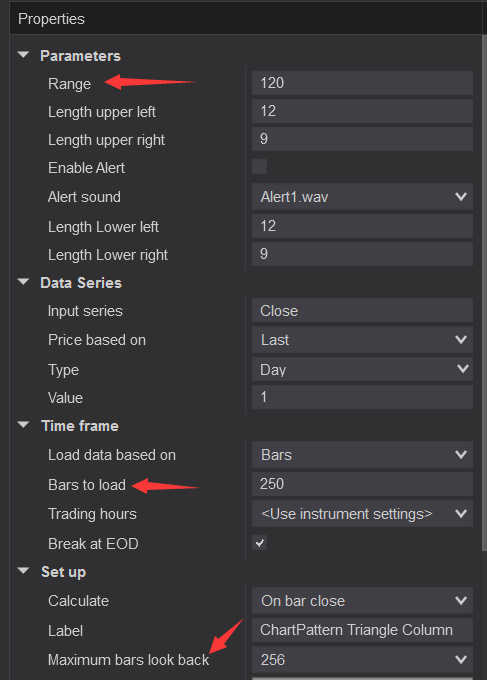
The only input you need to pay attention is the “Range” input, it defines the number of bars used to check when the latest Triangle Chart pattern formed.
Make sure the “Range” input is less than “Bars to load” and “Max bar look bar” settings.
It’s better to use a relatively large number for “Bars to load”, such as 500, depends on your “Range” input.
The following image is an example of how the Market Analyzer Column display.
In order to match the result on both chart and Market Analyzer, make sure the inputs used are exactly the same on both sides.
NinjaTrader 8 Triangle Chart pattern indicator for NT8, no link to buy, https://patternsmart.com/wp/ninjatrader-8-triangle-chart-pattern-indicator-for-nt8, how much? Do we know the type of triangle, where we will be the exit bullish or bearish?
You can purchase from https://www.patternsmart.com/cart/index.php?route=product/category&path=65