RSI Divergence indicator for Thinkorswim TOS
VIP price is: $99
This is an advanced version of RSI Divergence indicator for Thinkorswim.
RSI Divergence indicator gives possible reversal signals when there are discrepancies between RSI and price movement.
Divergence emerges when price and oscillator indicator move in different directions.
For instance, an uptrend Negative Divergence occurs when price reaches a higher high, but the indicator fails to follow. In a downtrend, positive divergence occurs when price reaches a lower low, yet the indicator does not reach a lower low.
For the most part, oscillator indicators and price trailing each other and move in the same direction. However, when they start to drift apart, the current trade may consolidate or exhibit a reverse pattern.
Features:
- Alert: provide both sound and message alert whenever a divergence is found. You can turn it on or off.
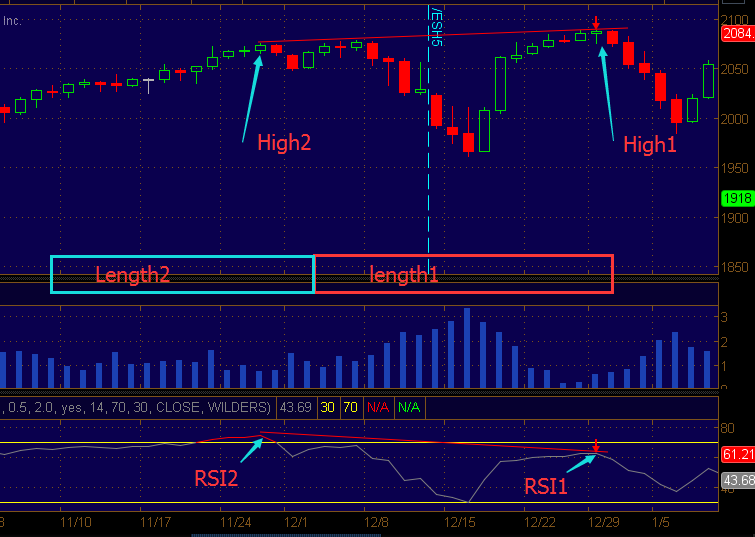
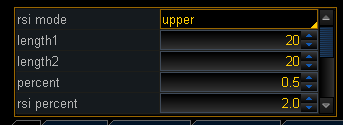
- Length 1&2: Define the range of bars which are used to calculate the recent High and previous High, as shown in picture.
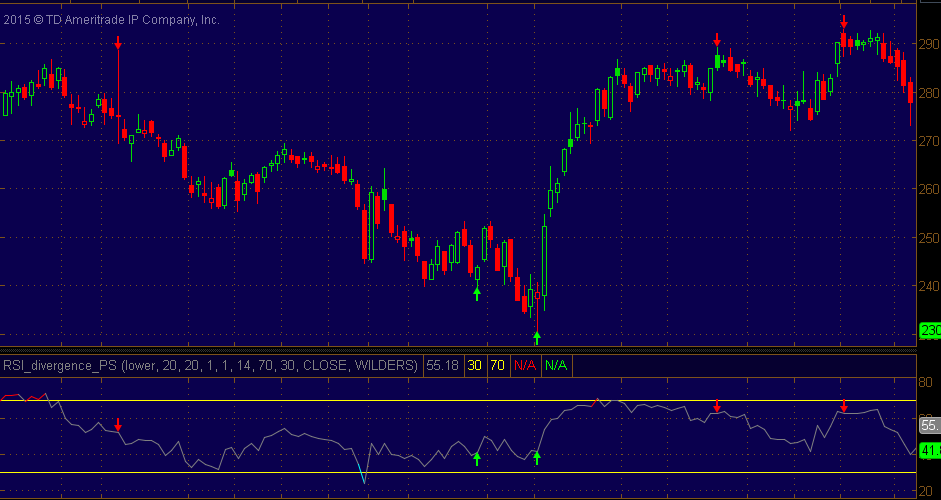
- RSI_mode: Choose “Upper” to only plot signal arrows on price chart.
Choose “lower” it will plot as a RSI indicator with divergence signals. - Percent: The difference between High1 and High2, as shown in picture.
- RSI_Percent: The difference between RSI1 and RSI2, as shown in picture.
- All Parameters of RSI: Adjust the inputs of RSI indicator.
How to use:
The purpose of divergence indicator is to spot when price indicator trend are moving into opposite directions.
Negative divergence:
First of all, we need to locate the recent High1 and its RSI1 value within the given range(lenght1).
Secondly, we find the previous High2 and its RSI2 value within the given range(lenght2).
Then we compare the ratio of these 2 Highs and RSI values to determine if they meet the percentage you set.
For example, if you set “percent=3”, then it will check if High1 is greater than High2 by 3%. If you set “rsi percent=5” then it will check if RSI1 is less than RSI2 by 5%.
If both percent conditions are met, there will be a red arrow pointing downward.
Positive divergence:
The indicator will find the recent Low1 and its RSI1 value within the given range(lenght1).
And then it will find the previous Low2 and its RSI2 value within the given range(lenght2).
If you set “percent=1”, then it will check if Low1 is less than Low2 by 1%. If you set “rsi percent=5” then it will check if RSI1 is greater than RSI2 by 5%.
If both percent conditions are met, there will be a green arrow pointing upward.
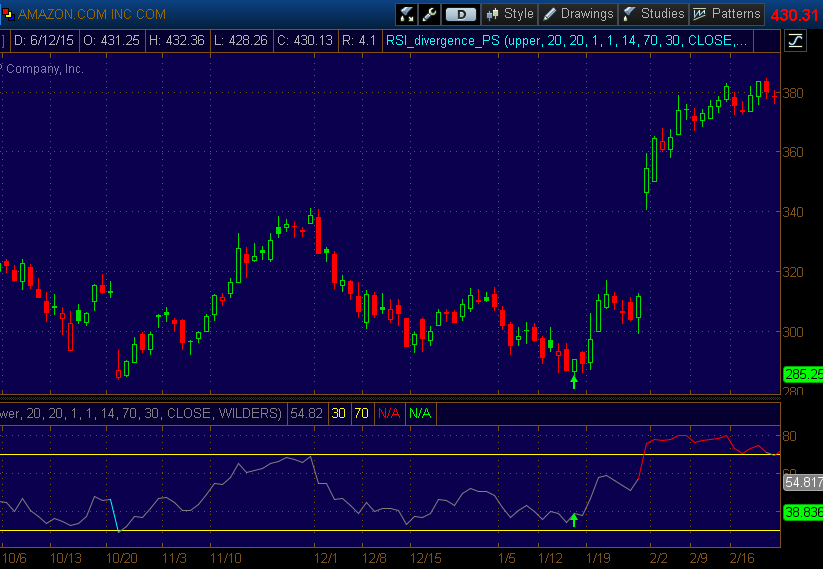
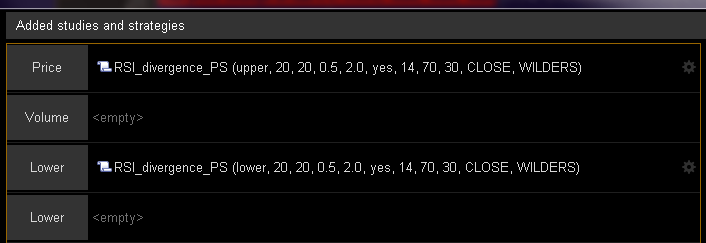
Please note: in order to plot this indicator on both price chart and lower chart, you need to load it in 2 places. And set RSI_mode to “Upper” in Price chart and RSI_mode to “lower” in Lower chart. As shown in the following picture.
If you want the same signals on both charts, all parameters have to be consistent on both sides.
This indicator works in any time period and applicable for all securities(Stocks, Futures, Forex, Options,ETF, etc.).
When you use this indicator in minute chart, it’s better to set “percent” less than 1, otherwise, lots of signals will be filtered.
If you want to add any feature to this indicator, please send us a Customization request.


How do I get this indicator.
http://www.patternsmart.com/cart/index.php?route=product/product&product_id=329&search=RSI+Divergence
I selected RSI divergence for $149 and clicked the Checkout but it does not take me to payment screen
bchandran@aol.com