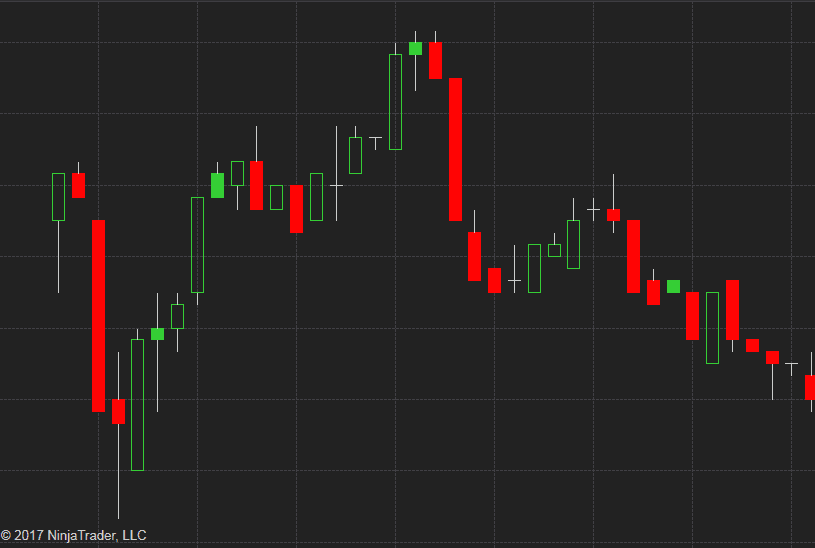
This candlestick chart type will show a candle is outlined in positive color if the current close price is higher than that on the previous time period.
On the contrary, if the current close price is lower than that on the previous period, the candle is outlined in negative color.
If the close price is lower than the open price and close price is higher than the previous one, it is filled with positive color. The candlestick will be solid green. Otherwise, it is hollow candlestick.
If the close price lower than the open price and close price is lower than the previous one, it is filled with negative color. The candlestick will be solid red. Otherwise, it is hollow candlestick.
It works on all timeframes.

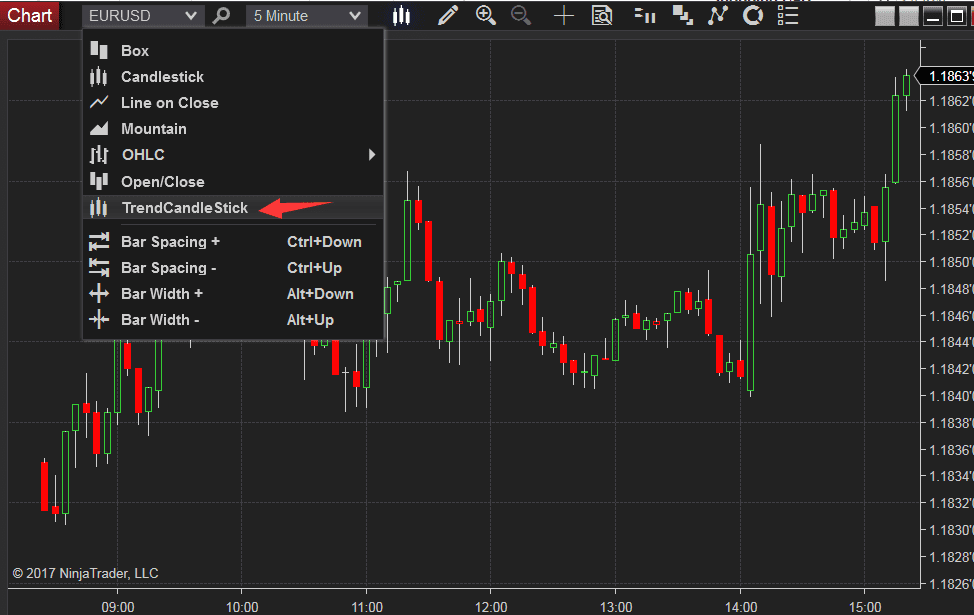
You can choose it from the Chart style tab:
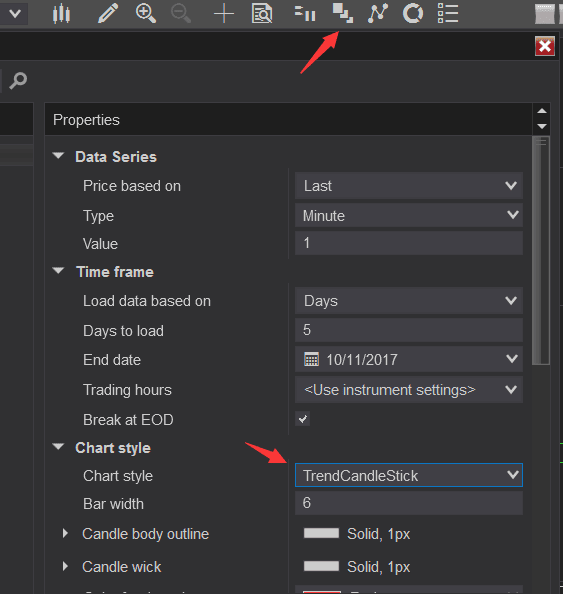
Or choose it from the Data tab.

What is the price for theTrend candlestick (hollow candle) chart type for Ninjatrader 8
Hi
You can purchase it from: http://www.patternsmart.com/cart/index.php?route=product/product&product_id=413&search=Trend+candlestick+%28hollow+candle%29+chart+type+for+Ninjatrader+8