The Dark Cloud Cover is a highly reliable, two-candle bearish reversal pattern that forms at the peak of an uptrend or near major resistance levels. The pattern signals a distinct shift in momentum where buyers initial optimism is aggressively overridden by aggressive selling pressure.
It gets its descriptive name because the second candle opens above the prior day’s high but finishes weak, casting a “dark cloud” over the prevailing bullish trend.
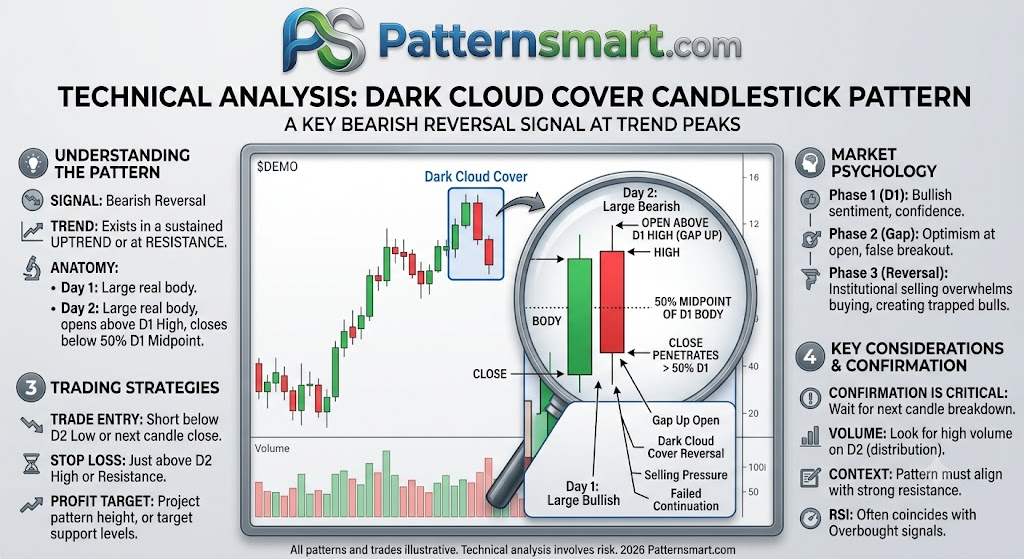
Anatomy of the Pattern
To classify a two-candle sequence as a valid Dark Cloud Cover pattern, the structure must meet these precise technical requirements:
- Trend Context: The pattern must appear during a clear, sustained uptrend or at the upper boundary of a consolidation zone.
- Candle 1 (Bullish): A strong, large-bodied green (or white) candlestick that indicates bulls remain comfortably in control of the trend.
- Candle 2 (Bearish): A major red (or black) candlestick that satisfies two structural criteria:
- The Gap Up: It must open above the closing price—or ideally above the high wick—of Candle 1.
- The Penetration: It must reverse downward and close below the 50% midpoint of Candle 1’s real body.
Important Distinction: If Candle 2 fails to penetrate past the 50% mark of Candle 1, the pattern is incomplete and lacks the institutional selling pressure needed to trigger a high-probability reversal. If Candle 2 completely engulfs the body of Candle 1, it transitions into a Bearish Engulfing pattern, which is a separate, equally aggressive reversal signal.
Market Psychology Behind the Movement
Analyzing the price action candle-by-candle reveals the classic trap laid out by major market participants:
- Climactic Buying: Candle 1 showcases standard bullish momentum. Buyers push price up to a strong close, instilling FOMO (fear of missing out) in retail traders.
- The Illusion of Strength: The next session opens with a significant gap up. This is usually driven by overnight news or retail traders buying the open, expecting an explosive continuation.
- The Institutional Reversal: Once the price hits these vulnerable overextended highs, institutional sellers or large short-sellers step in. They aggressively unload inventory, completely overwhelming the available buy orders.
- The Structural Shift: The price cascades downward all session, erasing more than half of the previous day’s hard-earned gains. Bulls who bought the gap up are now trapped underwater, creating a psychological catalyst for panic-selling on subsequent days.
Trading Strategies and Execution
Trading the Dark Cloud Cover pattern requires strategic risk management and a disciplined search for validation from subsequent candles.
| Element | Tactical Level | Execution Rules |
| Trade Entry | Short Position | Conservative: Wait for the next candle to close below the low of Candle 2 to confirm the structural shift. Aggressive: Enter short near the close of Candle 2 if volume is exceptionally high. |
| Stop Loss | Risk Management | Place a stop-loss order slightly above the highest wick of Candle 2. A break above this level invalidates the bearish thesis. |
| Profit Target | Take Profit | Utilize historical support lines, standard pivot levels, or project the height of the pattern downward to establish dynamic target zones. |
Key Technical Enhancements
To separate high-probability signals from market noise, savvy analysts look for these confirming factors:
Support/Resistance Alignment: A Dark Cloud Cover pattern that forms directly against a major multi-month horizontal resistance line or a key moving average (like the 200-day SMA) has an elevated probability of sparking a prolonged macro trend reversal.
Volume Expansion: The pattern is infinitely more reliable if the volume on the second (bearish) day is significantly higher than the volume on the first (bullish) day, confirming institutional distribution.
Overbought Indicators: If the Dark Cloud Cover prints while a momentum oscillator like the Relative Strength Index (RSI) is flashing an overbought signal (above 70), the structural setup becomes much stronger.
Please check our Bearish and Bullish Patterns Indicator collection.