Triangle formations are among the most recognized price patterns in classical technical analysis. They represent periods of market consolidation where buying and selling pressure gradually move toward equilibrium before price eventually breaks out in one direction.
During the formation of a triangle, price fluctuations typically become narrower as volatility contracts. This narrowing range reflects increasing market indecision, with neither buyers nor sellers able to establish complete control. Eventually, one side gains momentum, often leading to a breakout accompanied by increased trading activity.
Although triangle patterns are commonly associated with trend continuation, they should not automatically be interpreted as continuation signals. The eventual breakout direction depends on the surrounding market structure, trend strength, support and resistance levels, and overall market sentiment. For this reason, triangle patterns should always be evaluated within the broader context of price action rather than traded in isolation.
The Chart Pattern Triangle indicator recognizes three of the most widely accepted triangle formations used by technical analysts.
Ascending Triangle
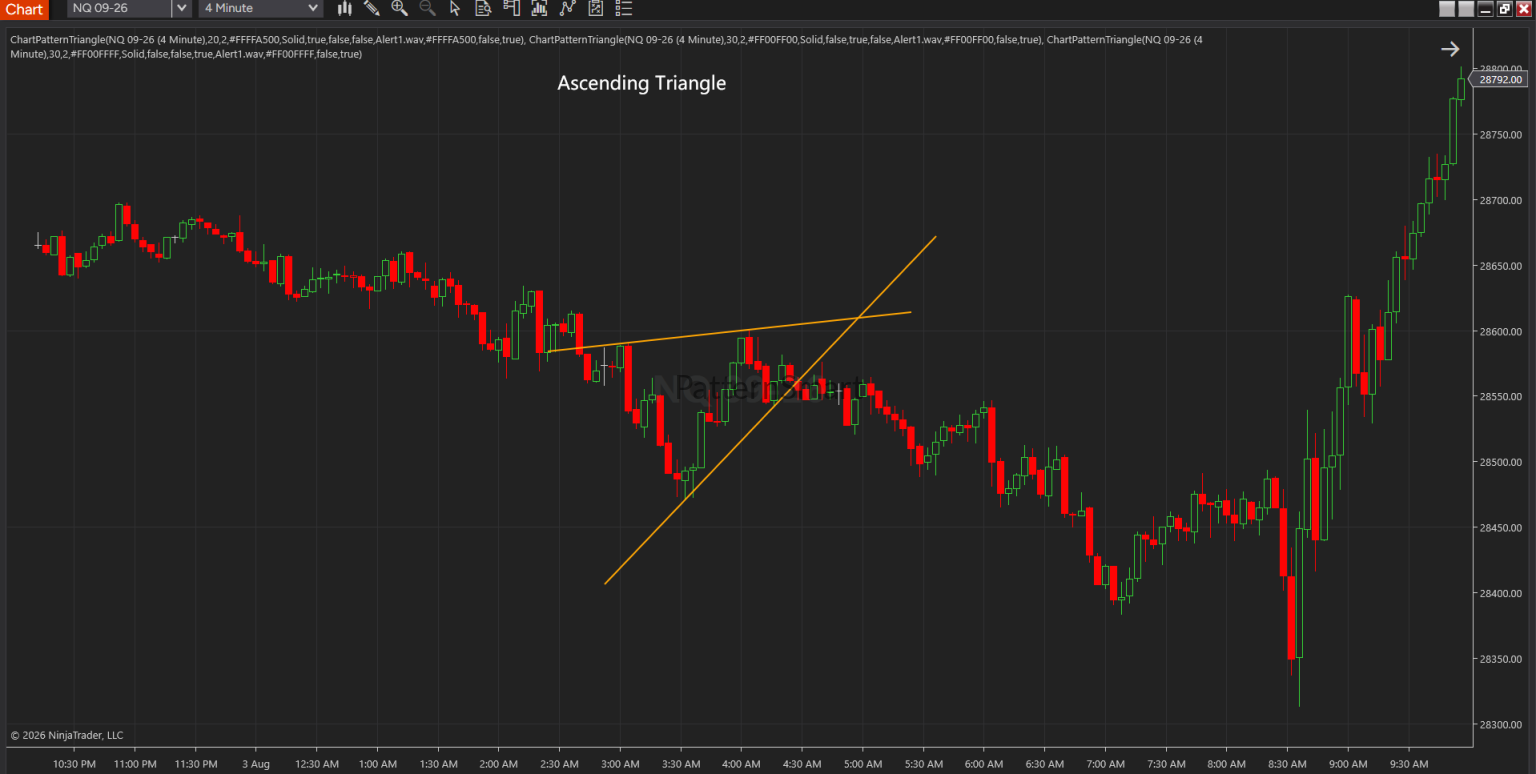
An Ascending Triangle is characterized by a relatively stable upper resistance area while the series of price lows gradually rises toward that resistance. This structure reflects increasing buying pressure as buyers become willing to enter the market at progressively higher prices.
As the pattern develops, sellers continue defending a similar resistance level, but buyers repeatedly reduce the depth of each pullback. This gradual shift in market balance often suggests strengthening bullish sentiment.
Market Psychology
An Ascending Triangle reflects growing optimism among market participants.
Each decline attracts buyers sooner than the previous one, indicating increasing confidence even before resistance has been broken. Sellers remain active at resistance, but their ability to force meaningful declines gradually weakens.
Eventually, buying pressure may become strong enough to overcome resistance, resulting in a breakout and the beginning of a new directional move.
Typical Characteristics
- Rising support structure
- Relatively stable resistance level
- Gradually decreasing price swings
- Contracting volatility
- Increasing pressure toward the resistance zone
Trading Applications
Many traders monitor Ascending Triangles as potential bullish breakout opportunities, particularly when they develop during established uptrends. Others use the pattern to identify important resistance levels while waiting for additional confirmation before entering a trade.
Rather than anticipating a breakout, many experienced traders prefer to wait until price demonstrates clear directional commitment before making trading decisions.
Descending Triangle
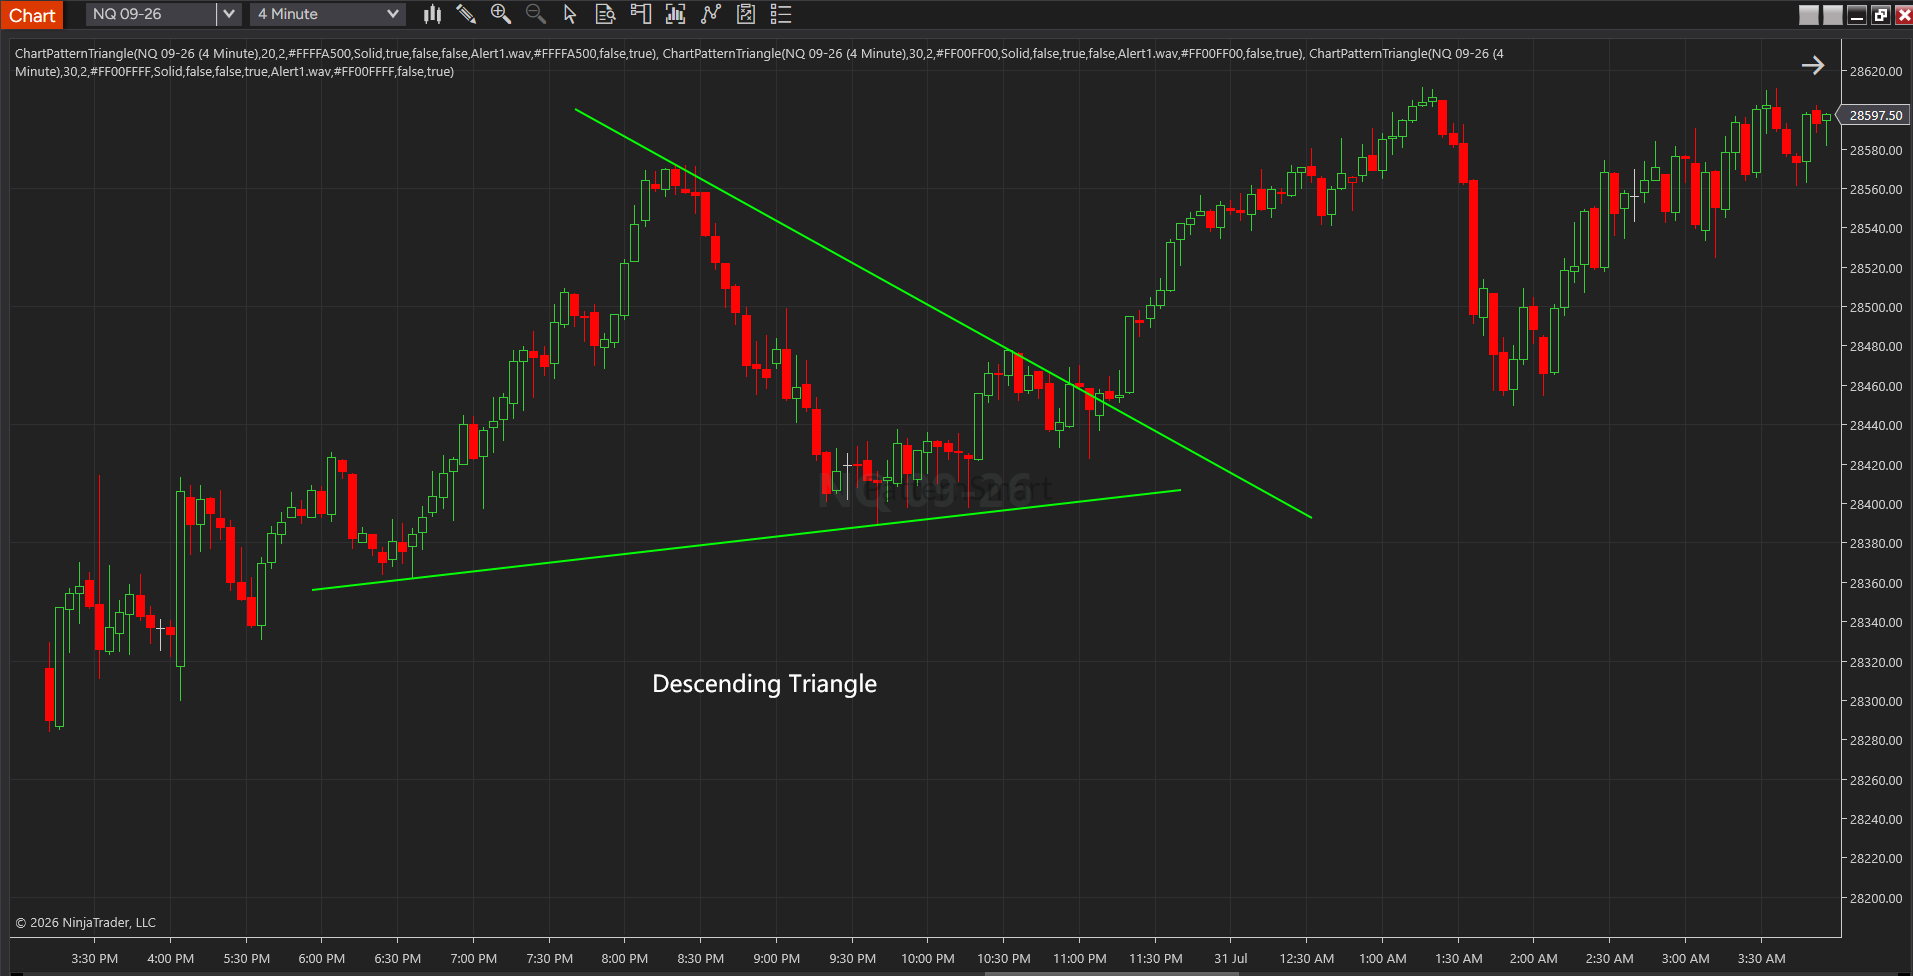
A Descending Triangle develops when price repeatedly tests a relatively stable support level while successive rallies become progressively weaker. This pattern illustrates increasing selling pressure as sellers continue pushing prices lower after each recovery.
Throughout the formation, buyers defend the support area, but their ability to generate meaningful rebounds gradually decreases. The result is a narrowing trading range that frequently precedes a significant directional move.
Market Psychology
A Descending Triangle represents growing bearish pressure.
Although buyers continue defending support, sellers become increasingly aggressive and recoveries lose momentum. This imbalance often signals that sellers are gradually gaining control of the market.
If support eventually fails, the resulting breakout may trigger increased selling activity as market participants react to the loss of an important price level.
Typical Characteristics
- Falling resistance structure
- Relatively stable support level
- Lower swing highs
- Contracting price movement
- Increasing pressure toward support
Trading Applications
Descending Triangles are frequently monitored for potential downside breakouts, particularly during existing downtrends. However, support occasionally holds, making confirmation essential before assuming a bearish continuation.
Many traders combine the pattern with volume analysis, trend confirmation, or higher-timeframe support and resistance before entering a position.
Symmetrical Triangle
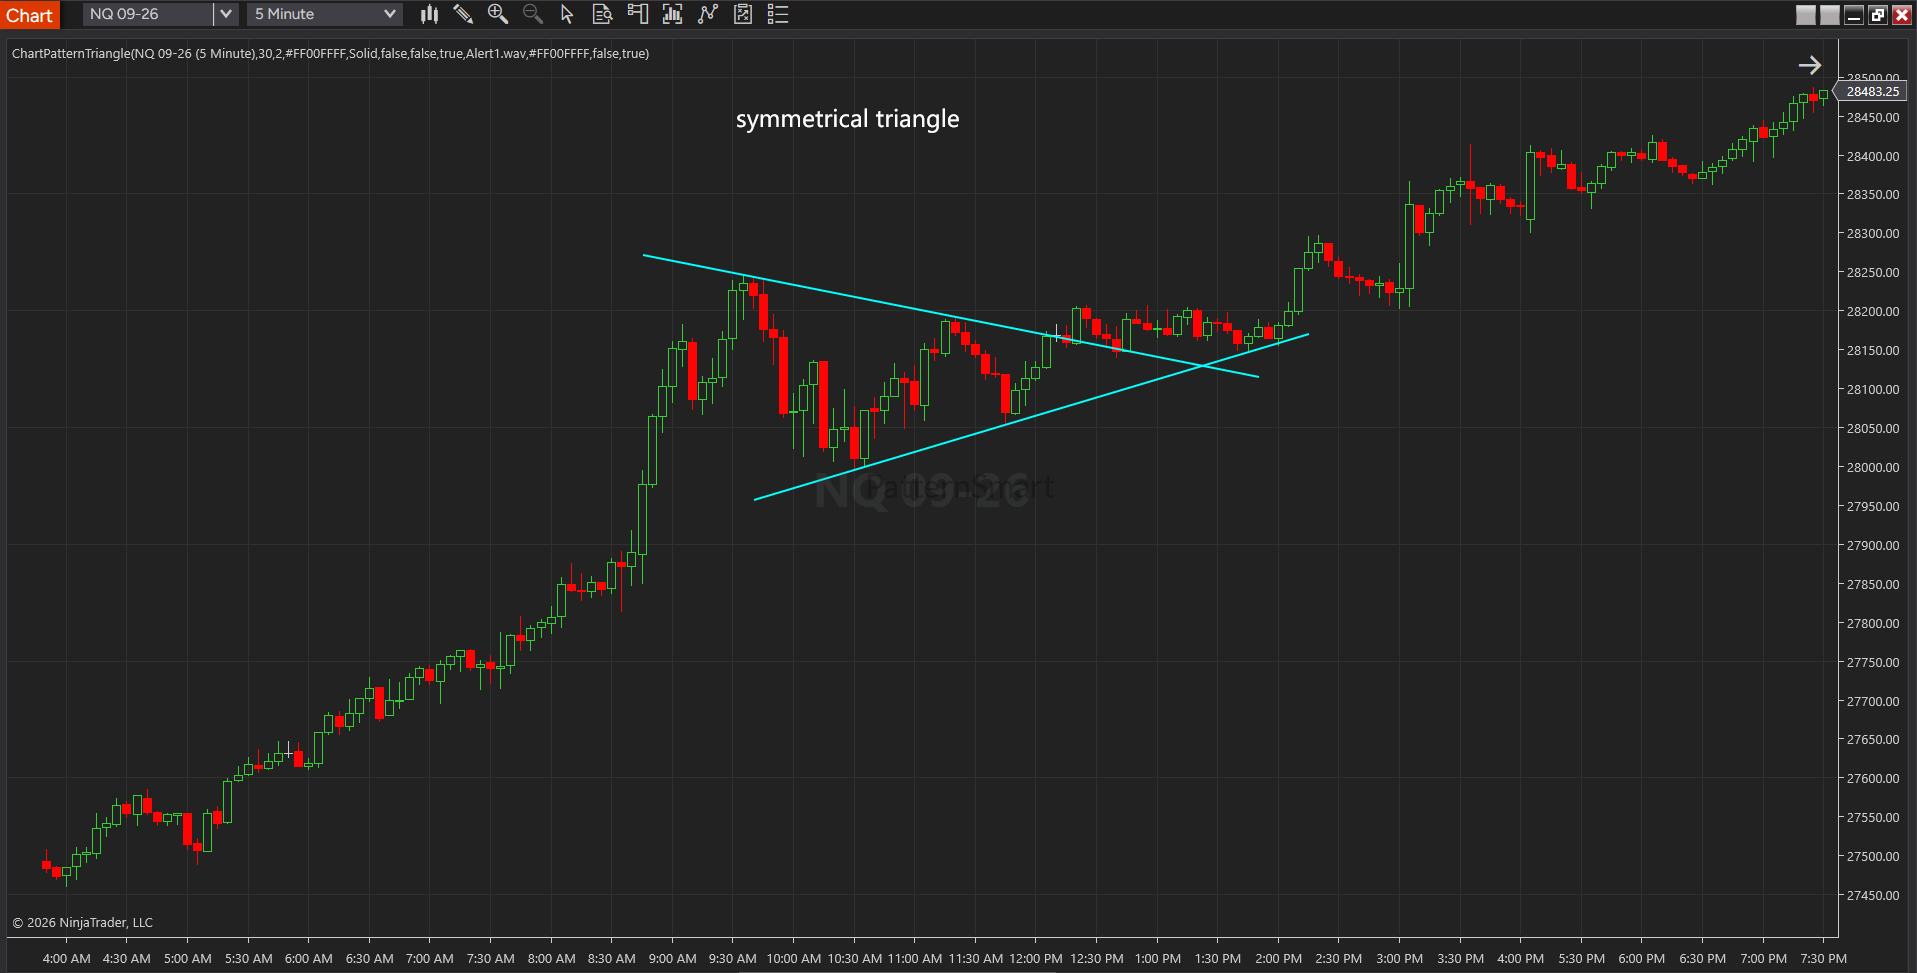
A Symmetrical Triangle forms when both the upper resistance boundary and lower support boundary gradually converge toward one another. Unlike Ascending and Descending Triangles, neither buyers nor sellers demonstrate a clear directional advantage during most of the formation.
Instead, both sides become increasingly cautious while volatility contracts.
Because market pressure builds from both directions simultaneously, the eventual breakout may occur either upward or downward.
Market Psychology
A Symmetrical Triangle represents temporary balance between buyers and sellers.
Both sides continue participating actively, yet neither is able to establish sustained control. As price fluctuations become progressively smaller, market participants often wait for new information or sufficient momentum before committing to larger positions.
The eventual breakout frequently reflects whichever side gains control first rather than any inherent directional bias within the pattern itself.
Typical Characteristics
- Converging support and resistance
- Lower highs and higher lows
- Narrowing price range
- Declining volatility
- Neutral directional bias until breakout
Trading Applications
Because Symmetrical Triangles do not favor either bullish or bearish outcomes, many traders avoid predicting breakout direction. Instead, they monitor the pattern for confirmation and react once price establishes a clear move beyond the triangle boundaries.
This objective approach helps reduce emotional decision-making and encourages traders to follow actual market behavior rather than expectations.
Triangle Patterns as Continuation or Reversal Structures
One of the most common misconceptions in technical analysis is that every triangle pattern is a continuation pattern.
In reality, triangle formations simply represent periods of price compression. While they frequently appear during existing trends and often continue in the same direction, they may also develop near important market turning points.
The significance of any triangle depends on its surrounding environment, including:
- The prevailing market trend
- Nearby support and resistance levels
- Overall market volatility
- Trading volume
- Higher-timeframe price structure
- Breakout confirmation
For this reason, the Chart Pattern Triangle indicator is designed to identify completed triangle structures objectively, allowing traders to evaluate each pattern within the broader context of their own trading methodology rather than relying solely on the pattern itself.
Combining Triangle Patterns with Other Analysis Tools
Triangle patterns are often most effective when used alongside other forms of technical analysis rather than as standalone trading signals.
Many traders choose to combine triangle formations with:
- Trend analysis
- Moving averages
- Support and resistance zones
- Volume confirmation
- Momentum indicators
- Multi-timeframe analysis
- Price action confirmation
Using multiple forms of confirmation can help traders distinguish between high-quality breakout opportunities and periods of temporary market noise.
The Chart Pattern Triangle indicator is intended to simplify the identification of triangle formations while giving traders the flexibility to integrate those patterns into virtually any technical trading strategy.
The Triangle Chart pattern indicator is available in these platforms: Ctrader, MetaTrader(MT4, MT5), NinjaTrader 8, MultiCharts, MultiCharts x.NET, Tradingview, Prorealtime, SierraChart.