Introduction
In modern financial markets, identifying potential shifts in market momentum before they manifest as visible price reversals is a primary objective for technical analysts. While price action represents the absolute truth of executed transactions, internal momentum metrics often reveal underlying exhaustion or sustained continuation long before price charts complete a structural turn.
Traditional Relative Strength Index (RSI) analysis frequently focuses on basic overbought and oversold thresholds. However, relying solely on static levels can generate premature or misleading analytical conclusions during strong, trending market conditions. The RSI Double Divergence Pro for cTrader addresses this limitation by applying PatternSmart’s structured, confirmation-first Double Divergence methodology directly to RSI momentum evaluations.
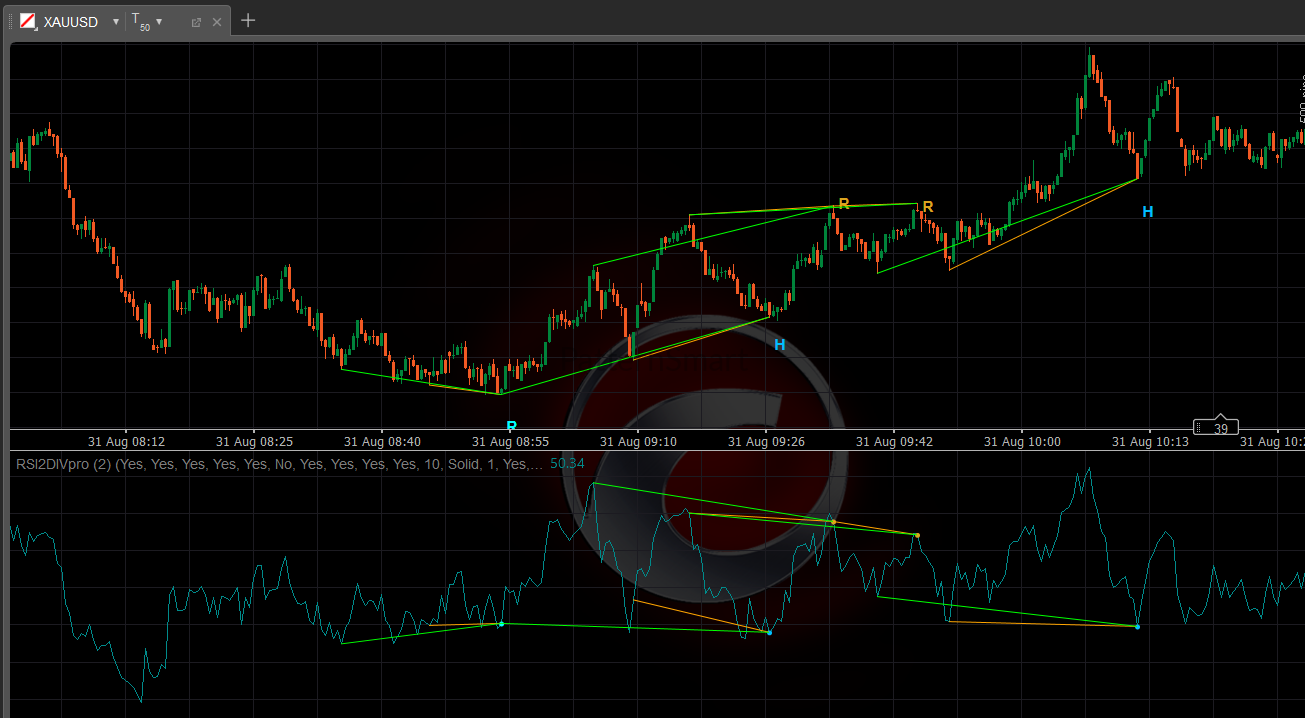
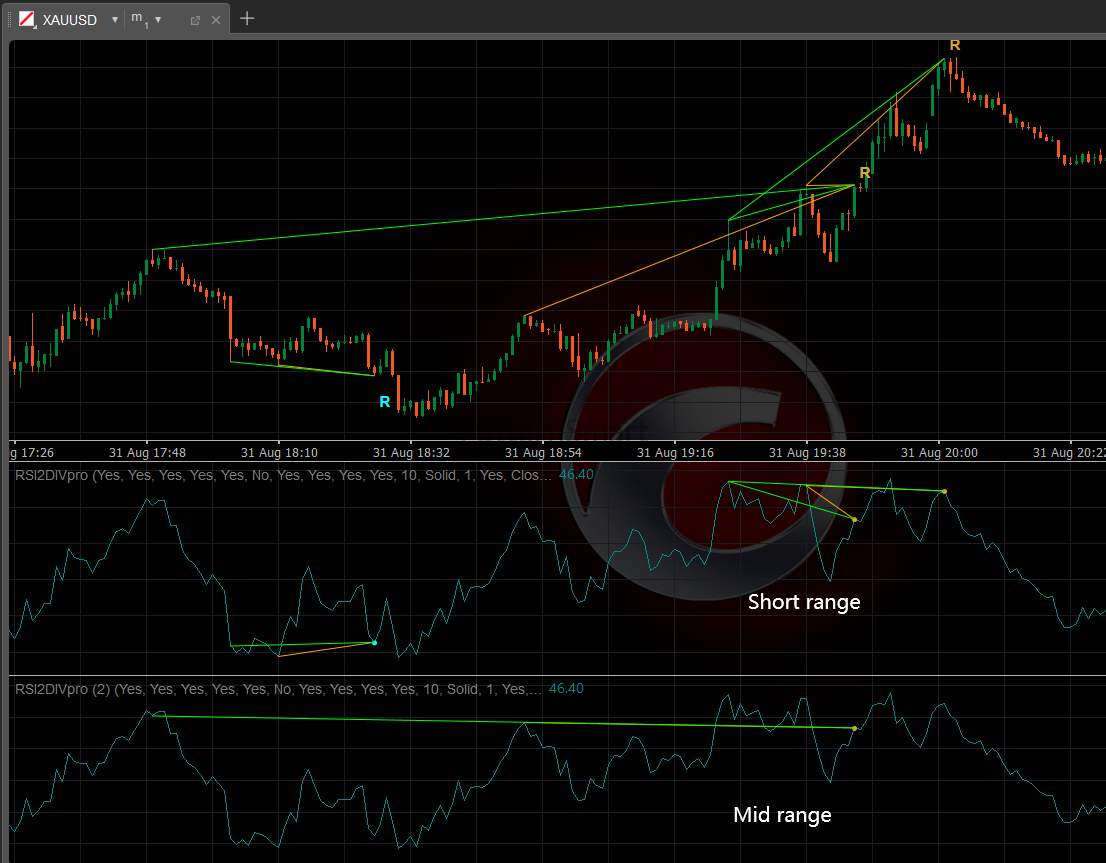
By systematically comparing price swing pivots against RSI oscillator behavior within cTrader’s native, high-performance charting environment, this indicator delivers objective technical evidence. Rather than offering predictive trade signals, RSI Double Divergence Pro provides structured momentum confirmation to help swing traders, intraday analysts, and multi-timeframe chartists evaluate changing market conditions with greater discipline.
Technical Overview & Indicator Classification
Momentum & Oscillator Characteristics
The Relative Strength Index (RSI) is classified as a momentum oscillator that measures the velocity and magnitude of directional price movements. By evaluating the ratio of average gains to average losses over a specified lookback period, RSI provides insight into the underlying buying and selling pressure driving the current trend.
When integrated into the Double Divergence framework, RSI serves as a sensitive measure of momentum acceleration and deceleration.
| Analytical Dimension | Indicator Characteristic |
| Primary Focus | Momentum shifts, rate of price change, and momentum exhaustion. |
| Indicator Classification | Momentum / Oscillator-Based Indicator. |
| Best Market Environment | Range-bound markets, swing environments, and mature trending phases. |
| Primary Strength | Early identification of momentum shifts prior to visible price structure turns. |
| Analytical Role | Provides additional technical confirmation; does not predict price direction. |
The Double Divergence Methodology
Traditional divergence analysis relies on isolated comparisons between price peaks and indicator swings. PatternSmart’s Double Divergence methodology expands upon this foundation by establishing a multi-layered evaluation framework requiring precise structural agreement between price action and momentum behavior.
Rather than predicting market turns, a divergence observation signifies a discrepancy in agreement between price action and momentum.
 Price Action (Swing Pivots)  <--->  RSI Oscillator Behavior
                               |
                               v
                     Discrepancy Detected
                               |
                               v
              Technical Confirmation Check
                               |
                               v
                 Structured Analytical Insight
- Price Action Leads: Price movement remains the primary source of analytical truth. Indicators offer secondary confirmation.
- Probability-Based Interpretation: Divergence indicates that current momentum may no longer fully support price direction. It does not guarantee a reversal or continuation.
- Confirmation-First Principle: Divergence observations gain analytical weight only when supported by broader market context, such as key support/resistance zones, candle patterns, or higher-timeframe trends.
Signal Classification & Interpretation
The RSI Double Divergence Pro for cTrader automatically identifies and classifies four distinct structural divergence events, providing clear, probability-based analytical evidence for market evaluation.
                    ┌─────────────────────────┐
                    │ Divergence Classification│
                    └────────────┬────────────┘
                                 │
           ┌─────────────────────┴─────────────────────┐
           ▼                                           ▼
┌────────────────────┐                       ┌────────────────────┐
│ Regular Divergence │                       │ Hidden Divergence  │
│(Momentum Exhaustion)                       │(Trend Continuation)│
└──────────┬─────────┘                       └──────────┬─────────┘
     ┌─────┴─────┐                                 ┌─────┴─────┐
     ▼           ▼                                 ▼           ▼
┌─────────┐ ┌─────────┐                       ┌─────────┐ ┌─────────┐
│ Bullish │ │ Bearish │                       │ Bullish │ │ Bearish │
└─────────┘ └─────────┘                       └─────────┘ └─────────┘
Regular Divergence (Potential Momentum Exhaustion)
Regular divergence develops when price establishes a new structural extreme that the RSI oscillator fails to confirm. This condition suggests that underlying buying or selling pressure is decelerating despite price expansion.
- Bullish Regular Divergence: Price forms a Lower Low, but RSI forms a Higher Low.
- Analytical Interpretation: Downward price momentum is weakening. Sellers are driving price to new lows, but with less relative intensity, signaling potential momentum exhaustion.
- Bearish Regular Divergence: Price forms a Higher High, but RSI forms a Lower High.
- Analytical Interpretation: Upward price momentum is decelerating. Buyers are pushing price to new highs, but the underlying rate of gain is diminishing.
Hidden Divergence (Potential Trend Continuation)
Hidden divergence occurs when the RSI oscillator reaches a new relative extreme while price maintains its higher timeframe structural trend. This relationship suggests that temporary price consolidations or pullbacks have refreshed momentum in favor of the prevailing trend.
- Bullish Hidden Divergence: Price forms a Higher Low, but RSI forms a Lower Low.
- Analytical Interpretation: Price holds a higher structural trough during a pullback, even as RSI resets to a deeper level. This indicates underlying buying strength and potential trend continuation.
- Bearish Hidden Divergence: Price forms a Lower High, but RSI forms a Higher High.
- Analytical Interpretation: Price fails to exceed previous swing highs during a temporary bounce, while RSI surges to a higher relative peak. This points to persistent selling pressure and potential downtrend continuation.
Native cTrader Integration & Workflow
Designed natively in C# for the cTrader platform, RSI Double Divergence Pro takes full advantage of cTrader’s modern charting capabilities, high-performance execution engine, and customizable user interface.
  cTrader Chart Engine (C# API)
            │
            ├── High-Precision Swing Pivot Detection
            │
            ├── Native Rendering (Multi-Timeframe Sync)
            │
            └── Real-Time Alert Engine (Pop-Up, Sound)
Seamless Charting & Visualization
- Native Rendering: Divergence lines and signal markers are drawn directly onto cTrader charts with vector-level precision, ensuring zero lag or visual distortion during rapid price zooming.
- Multi-Timeframe Workspace Synchronization: Effortlessly analyze RSI divergence across multiple chart intervals simultaneously using cTrader’s native multi-chart layouts.
- Customizable Color Schemes: Fully tailor line styles, line thicknesses, and marker colors to match light or dark cTrader chart themes.
Real-Time Notification Engine
Never miss an analytical event. The indicator integrates directly with cTrader’s native notification system to deliver real-time updates:
- In-App Pop-up Alerts: Immediate visual notifications within the cTrader interface.
- Audible Alerts: Sound alerts triggered upon bar close when a valid structural divergence is confirmed.
Configurable Software Parameters
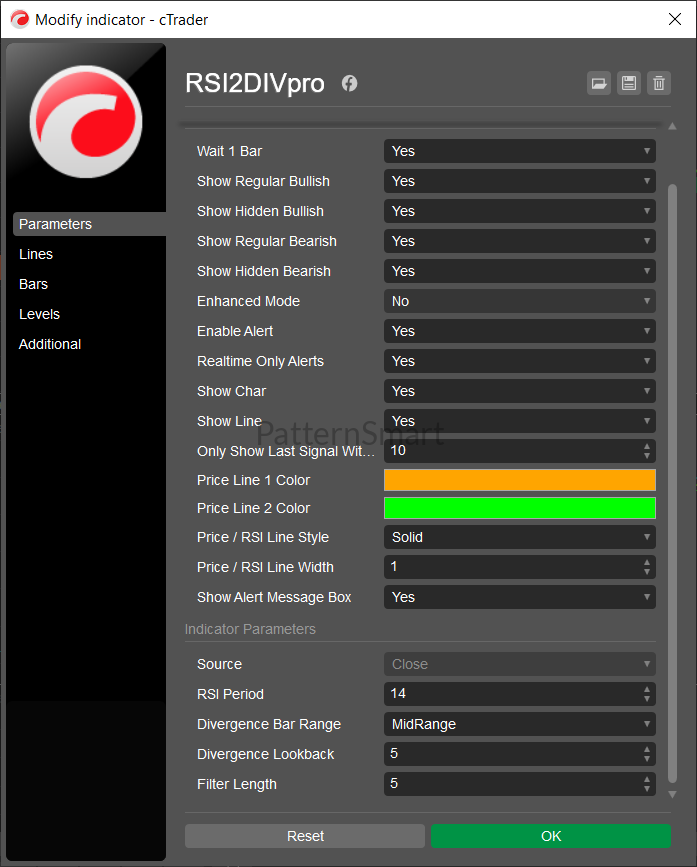
The software provides full control over structural pivot sensitivity, calculation methods, and visual displays. Official parameter names from the inputs menu include:
Core Calculation Settings
RSI Period: Defines the lookback period for the underlying RSI calculation (Default: 14).Pivot Sensitivity: Adjusts the number of left and right bars required to confirm a price or indicator swing pivot. Higher values isolate major structural swings; lower values capture short-term intraday pivots.
Divergence Detection Settings
Enable Regular Divergence: Toggles the detection and display of Bullish and Bearish Regular Divergence signals (True/False).Enable Hidden Divergence: Toggles the detection and display of Bullish and Bearish Hidden Divergence signals (True/False).Max Lookback Bars: Sets the maximum historical bar range evaluated when connecting two swing points for potential divergence.
Display & Alert Options
Bullish Divergence Color: Configures the line and marker color for bullish events.Bearish Divergence Color: Configures the line and marker color for bearish events.Show Divergence Lines: Toggles the rendering of visual trendlines connecting price pivots and oscillator pivots (True/False).Enable Pop-up Alerts: Activates cTrader desktop notifications upon signal confirmation (True/False).Enable Sound Alerts: Activates audio notifications (True/False).
Practical Analytical Applications & Benefits
Swing Trading & Reversal Timing
Swing traders can utilize Bullish and Bearish Regular Divergence to identify key market turning points near established support and resistance zones. When price tests a major structural boundary while RSI exhibits regular divergence, the probability of a momentum shift increases, providing an objective area to look for confirmation entry patterns.
Trend-Following & Pullback Analysis
During strong market trends, hidden divergence helps trend-following traders evaluate whether pullbacks represent temporary pauses or structural shifts. Identifying Bullish Hidden Divergence during an uptrend pullback provides technical evidence that the broader trend remains intact, helping traders avoid premature exits.
Summary of Analytical Benefits
- Eliminates Subjectivity: Replaces manual trendline drawing with automated, objective algorithms based on strict structural rules.
- Enhances Decision Quality: Focuses on confirmed swing pivots rather than unconfirmed intra-bar fluctuations.
- Supports Multi-Asset Strategies: Functions consistently across Forex, Equity Indices, Commodities, and Cryptocurrencies traded on cTrader.
- Reduces Cognitive Load: Clear visual markers and automated alerts allow analysts to monitor multiple instruments without manual effort.
Frequently Asked Questions
Does RSI Double Divergence Pro generate automatic buy and sell trade signals?
No. The indicator is an analytical tool designed to provide technical evidence regarding market momentum and trend structure. It identifies structural divergence events to support disciplined analysis, not automated entry or exit execution.
What is the difference between Regular and Hidden Divergence?
Regular Divergence occurs when price forms a new extreme but the RSI oscillator fails to confirm it, signaling potential momentum exhaustion or reversal. Hidden Divergence occurs when the RSI oscillator reaches a new extreme but price holds its structural trend, signaling potential trend continuation.
Which chart timeframes are best suited for RSI Double Divergence Pro?
The Double Divergence methodology is timeframe-independent. It applies the same analytical principles whether used on 5-minute intraday charts, 1-hour swing charts, or Daily position charts. Traders should choose timeframes aligned with their individual trading styles.
Can I adjust the indicator to show fewer, more significant signals?
Yes. Increasing the Pivot Sensitivity parameter requires more bars to confirm swing highs and lows, effectively filtering out minor market noise and highlighting larger structural divergences.
Is this indicator compatible with cTrader Web and Mobile?
RSI Double Divergence Pro is built using the cTrader C# API for the desktop edition. While custom C# indicators render within the cTrader Desktop platform, alerts can be configured to notify mobile devices via email or platform notifications.
Conclusion
The RSI Double Divergence Pro for cTrader brings professional-grade momentum analysis to one of the industry’s most advanced trading environments. By automating the detection of Regular and Hidden Divergence across strict structural swing points, it provides market analysts with clear, probability-based technical evidence.
Whether evaluating potential reversal zones or confirming trend continuation during pullbacks, RSI Double Divergence Pro strengthens decision quality by prioritizing analytical discipline over speculation.
Next Steps
Enhance your technical analysis workflow on cTrader today:
- Explore the Software: [Purchase Official cTrader Premium License]
- Deepen Your Knowledge: Review our comprehensive educational guides on multi-timeframe confirmation and momentum analysis in the PatternSmart Knowledge Base. Read the master guide on the Double Divergence Indicator Series.
- Upgrade Your Analysis: Integrate objective Double Divergence analysis into your cTrader workspace and elevate your market evaluation process. Visit the Technical Inputs Manual: Double Div Pro for full parameter tuning.