Successful chart pattern recognition is not simply about drawing lines between swing highs and swing lows. It is about identifying meaningful price structures in a consistent, objective, and repeatable manner.
The Chart Pattern Triangle indicator was developed with this philosophy in mind. Rather than attempting to identify every shape that resembles a triangle, the indicator focuses on recognizing well-defined market structures using a consistent set of objective criteria. This approach helps reduce subjectivity while providing traders with reliable and repeatable analysis across different markets and chart types.
Objective Rather Than Subjective Analysis
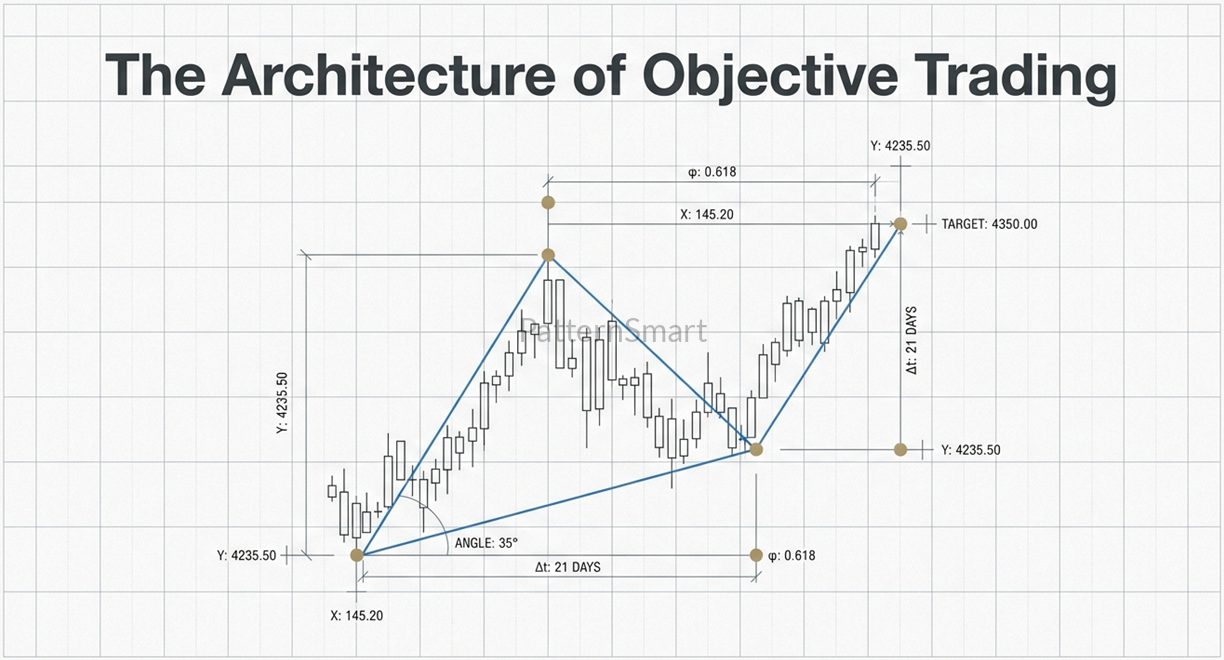
One of the biggest challenges in manual chart pattern analysis is subjectivity.
Ask several experienced traders to draw triangle patterns on the same chart, and it is common to receive several different interpretations. Some traders may draw trend lines using candle bodies, while others prefer swing highs and lows. Some may identify a pattern early, while others wait for additional confirmation.
None of these approaches are necessarily wrong—they simply reflect individual trading styles.
The Chart Pattern Triangle indicator removes this inconsistency by evaluating every chart using the same objective methodology. Every market, symbol, and timeframe is analyzed according to the same standards, producing consistent results regardless of who is using the indicator.
Consistency Builds Confidence

Consistency is one of the most important advantages of automated chart analysis.
When manually reviewing hundreds of charts, it is easy for fatigue, emotion, or personal bias to influence pattern recognition. The same chart may even be interpreted differently by the same trader on different days.
By applying identical evaluation standards to every chart, the indicator delivers repeatable results that help traders build confidence in their analysis and maintain a disciplined workflow.
Quality Over Quantity

More detected patterns do not necessarily lead to better trading decisions.
Charts frequently contain temporary price movements that may visually resemble triangle formations but lack the structural characteristics needed for meaningful technical analysis.
For this reason, the indicator is designed to emphasize well-defined market structures rather than attempting to identify every possible triangle-like shape.
This selective approach helps reduce unnecessary chart clutter and allows traders to focus on patterns that are more suitable for further analysis.
Why Some Triangles Are Not Detected
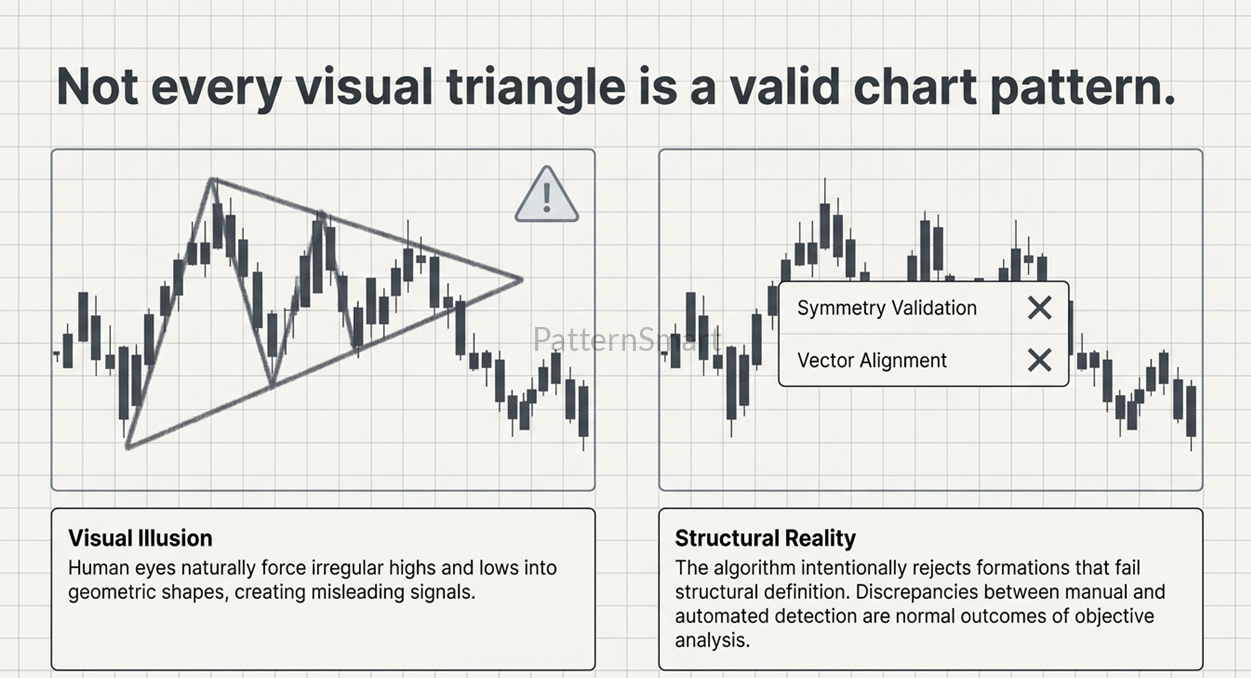
One of the most common questions from traders is:
“I can see a triangle on my chart. Why wasn’t it detected?”
The answer is simple: not every visual triangle represents a well-defined chart pattern.
Financial markets are naturally irregular, and price action rarely forms perfect geometric shapes. Human traders can often connect almost any series of highs and lows to create a triangle, but doing so may produce inconsistent or misleading analysis.
The Chart Pattern Triangle indicator intentionally avoids identifying every visually similar formation. Instead, it focuses on patterns that meet a consistent structural definition, helping ensure that detected patterns remain objective and repeatable.
As a result, manually drawn triangles and automatically detected triangles may occasionally differ. This is a normal outcome of applying objective pattern recognition rather than subjective interpretation.
Completed Structures Provide Greater Clarity

Markets are constantly evolving.
A developing consolidation may appear to be forming a triangle, only to change shape several bars later.
Displaying incomplete formations too early can lead to unnecessary signals and frequent revisions as price continues to develop.
For this reason, the Chart Pattern Triangle indicator is designed to identify completed triangle structures. Once a pattern has fully formed, it provides traders with a clear and stable visual reference for further analysis.
This approach encourages traders to evaluate confirmed market structure instead of reacting to formations that are still evolving.
Designed to Assist, Not Replace, the Trader

No chart pattern should be viewed as a standalone trading signal.
Triangle formations represent only one aspect of technical analysis and should always be interpreted within the broader market context.
Experienced traders often combine chart patterns with additional forms of analysis, such as:
- Overall market trend
- Support and resistance
- Price action
- Volume
- Momentum indicators
- Multi-timeframe analysis
- Risk management principles
The Chart Pattern Triangle indicator is designed to simplify the pattern recognition process, allowing traders to spend less time searching for setups and more time evaluating whether those setups align with their own trading methodology.
A Tool for Objective Market Analysis

The primary purpose of the Chart Pattern Triangle indicator is not to predict the future, but to provide an objective framework for identifying one of the market’s most widely recognized consolidation structures.
By combining automated recognition with consistent evaluation standards and professional chart visualization, the indicator helps traders analyze market structure more efficiently while reducing the variability that naturally occurs with manual pattern identification.
Ultimately, successful trading decisions remain the responsibility of the trader. The indicator provides reliable technical information; how that information is interpreted and incorporated into a trading plan is entirely up to the individual user.
The Triangle Chart pattern indicator is available in these platforms: Ctrader, MetaTrader(MT4, MT5), NinjaTrader 8, MultiCharts, MultiCharts x.NET, Tradingview, Prorealtime, SierraChart.