The Chart Pattern Triangle indicator is designed to help traders identify well-defined triangle formations efficiently and consistently. While the indicator automatically detects completed patterns, how those patterns are incorporated into a trading plan ultimately depends on the trader’s methodology and market experience.
The following practices can help traders make more effective use of the indicator in a wide variety of market conditions.
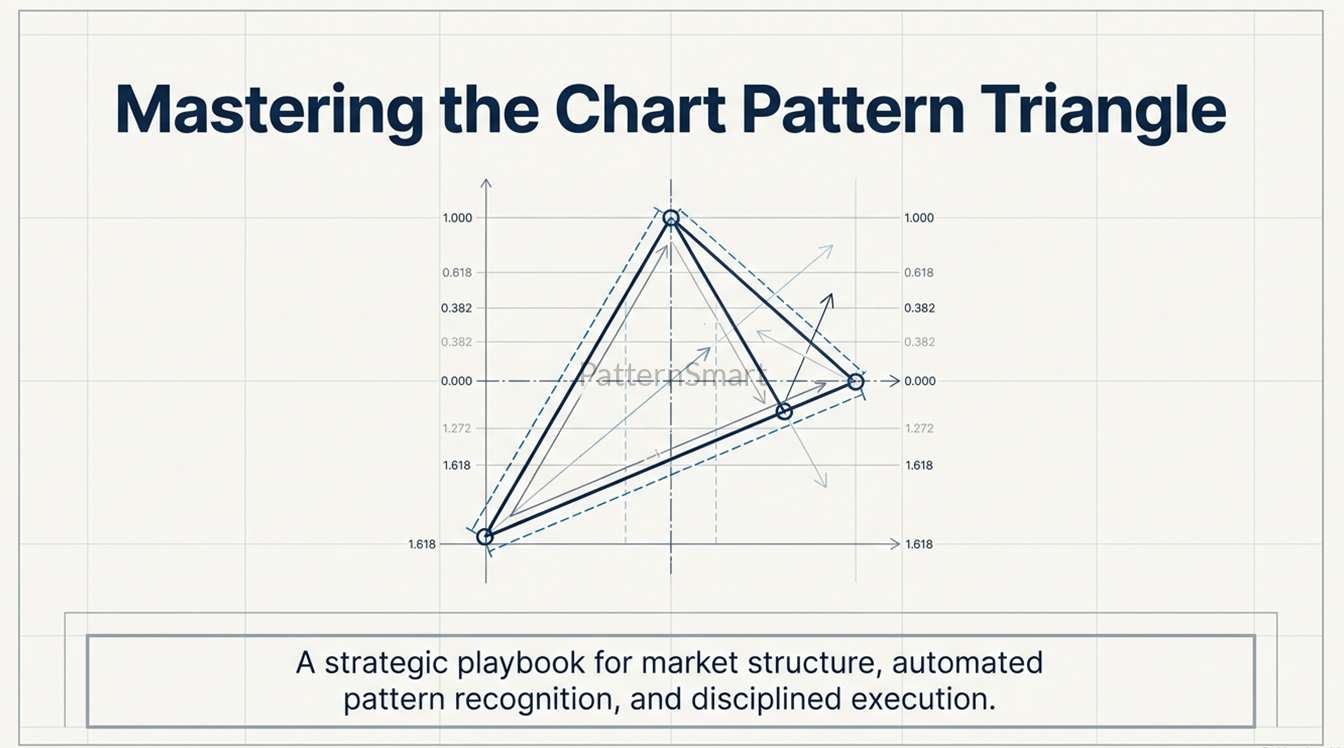
Identify Market Consolidation

Triangle formations often represent periods of market consolidation where buying and selling pressure gradually moves toward equilibrium.
During these phases, price volatility typically contracts as the trading range becomes progressively narrower. Although the eventual breakout direction is unknown while the pattern is forming, recognizing these consolidation structures allows traders to prepare for potential increases in market activity.
Rather than constantly searching for consolidations manually, the Chart Pattern Triangle indicator automatically highlights completed triangle formations, allowing traders to focus on evaluating the surrounding market context.
Monitor Potential Breakout Opportunities

One of the most common applications of triangle patterns is preparing for potential breakout opportunities.
Once a completed triangle has been identified, traders can monitor price action near the upper and lower boundaries for confirmation of a directional move.
Instead of predicting whether price will break upward or downward, many experienced traders prefer to allow the market to confirm the breakout before making trading decisions.
This objective approach helps reduce emotional bias while encouraging disciplined trade planning.
Use Triangle Boundaries as Dynamic Support and Resistance

The extended triangle boundaries can continue serving as valuable reference levels even after the original pattern has completed.
Many traders observe these projected lines to evaluate:
- Potential support levels
- Potential resistance levels
- Breakout retests
- Pullback opportunities
- Failed breakouts
- Areas where market structure may change
Rather than treating the triangle as a completed historical event, extending the trend lines allows the pattern to remain useful as future price action develops.
Build a Multi-Layer View of Market Structure
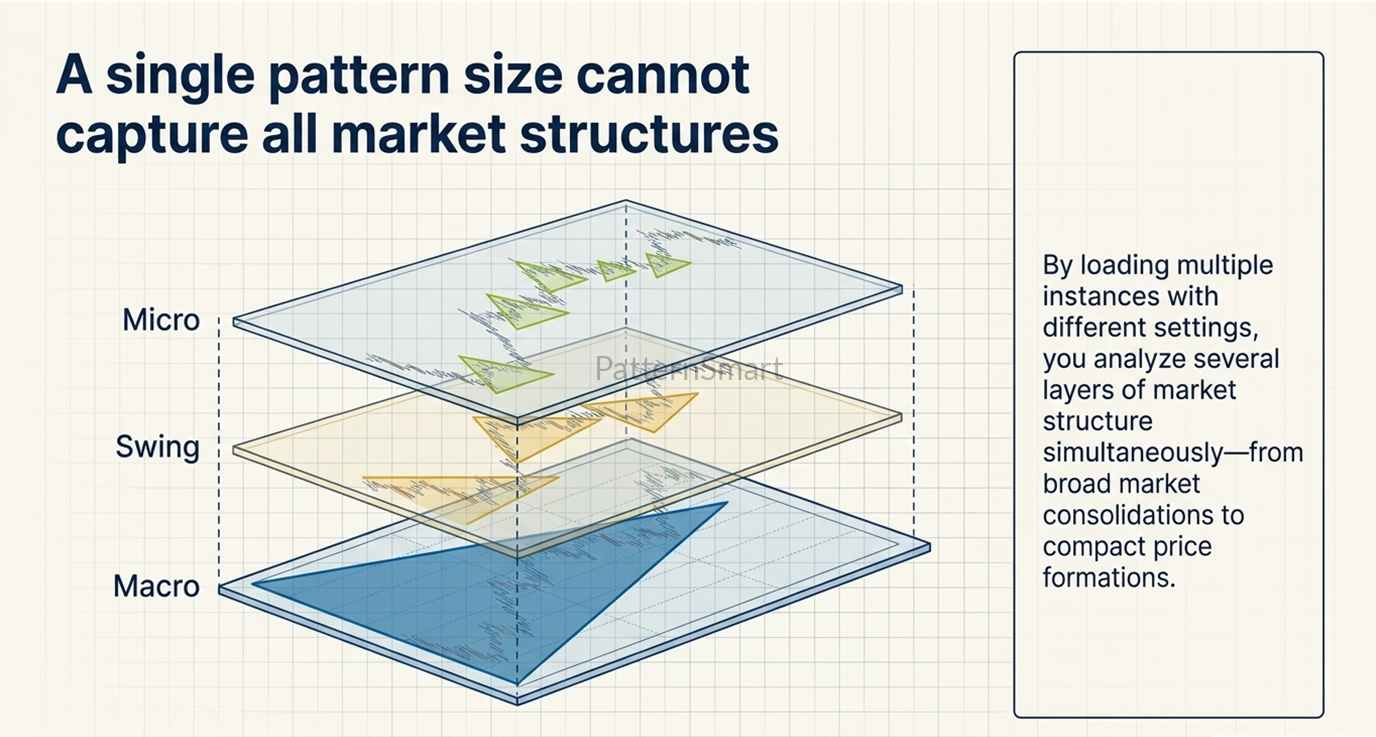
One of the most effective ways to use the Chart Pattern Triangle indicator is to display multiple Pattern Sizes on the same chart.
A single Pattern Size cannot capture every market structure. Smaller settings emphasize compact price formations, while larger settings reveal broader market consolidations that develop over more bars.
By loading multiple instances of the indicator with different Pattern Size settings, traders can analyze several layers of market structure simultaneously.
This approach provides a much more complete view of price action than relying on a single Pattern Size alone.
Color-Code Different Pattern Sizes

When using multiple indicator instances, assigning a unique color to each Pattern Size allows traders to identify different market structures instantly.
For example:
- Small — Lime
- Medium — Yellow
- Large — Blue
With this configuration, traders can immediately distinguish between short-, medium-, and long-duration triangle formations without checking the indicator settings.
The result is a clean, intuitive chart where the relative size of each detected pattern is immediately recognizable.
This technique is particularly useful when analyzing complex market conditions where several triangle formations may exist simultaneously.
Combine Pattern Size with Pattern Type

Multiple indicator instances can also be configured with different combinations of enabled triangle types.
For example:
Instance 1
- Pattern Size: Small
- Symmetrical Triangle only
- Lime
Instance 2
- Pattern Size: Medium
- Ascending Triangle and Descending Triangle
- Yellow
Instance 3
- Pattern Size: Large
- All Triangle Types
- Blue
This combination of Pattern Size, triangle type, and color coding creates a highly organized chart where different market structures can be identified almost instantly.
Rather than relying solely on labels or manually reviewing indicator settings, traders can recognize the characteristics of each pattern through its visual presentation alone.
Because every trader analyzes markets differently, countless combinations are possible. Users are encouraged to experiment with different configurations to create a workflow that best matches their own trading methodology.
Combine with Other Technical Analysis

Although triangle patterns provide valuable information about market structure, they should not be interpreted in isolation.
Many traders combine the Chart Pattern Triangle indicator with additional analytical tools, including:
- Overall trend analysis
- Support and resistance zones
- Price action confirmation
- Volume analysis
- Moving averages
- Momentum indicators
- Multi-timeframe analysis
Using multiple forms of confirmation can improve confidence while reducing the likelihood of acting on isolated chart patterns alone.
Adapt the Pattern Size to Your Trading Objective
There is no universally “best” Pattern Size.
The ideal setting depends on the type of market structure you wish to identify.
If your chart becomes crowded with numerous small patterns, increasing the Pattern Size may help focus attention on larger and more significant market structures.
Conversely, if very few patterns are detected, reducing the Pattern Size may reveal shorter-duration consolidations that better suit your analytical objectives.
Rather than matching the Pattern Size to a particular timeframe, consider matching it to the scale of the price structures you wish to study.
Keep Charts Organized
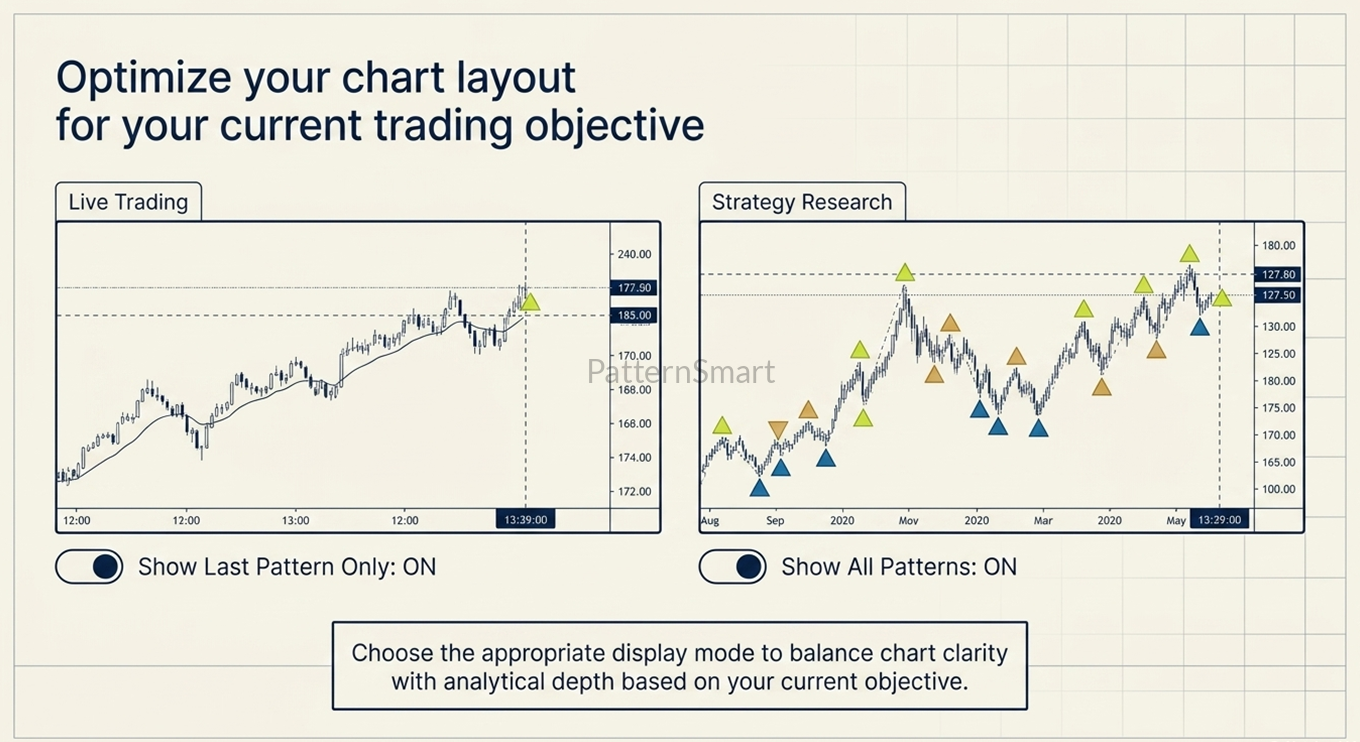
Different trading situations may require different chart layouts.
For live trading, many traders prefer enabling Show Last Pattern Only to maintain a clean workspace and concentrate on the current market structure.
During historical review or strategy research, displaying all detected patterns can provide valuable insight into how triangle formations developed over time and how price behaved after each completed structure.
Choosing the appropriate display mode helps balance chart clarity with analytical depth.
Study Historical Patterns

One of the best ways to improve chart-reading skills is to review historical triangle formations.
Rather than focusing solely on successful breakouts, study a variety of outcomes, including:
- Trend continuations
- Trend reversals
- Failed breakouts
- False breakouts
- Successful retests
Reviewing both successful and unsuccessful examples provides a more complete understanding of how triangle patterns behave under different market conditions.
Let the Indicator Support Your Analysis
The Chart Pattern Triangle indicator is designed to improve the efficiency and consistency of chart pattern recognition—not to replace the trader’s judgment.
Its greatest value lies in providing an objective framework for identifying market structure while allowing traders to apply their own experience, trading rules, and risk management principles.
When combined with sound technical analysis and disciplined execution, the indicator becomes a powerful tool for recognizing, organizing, and evaluating triangle formations across virtually any market or chart type.