Introduction
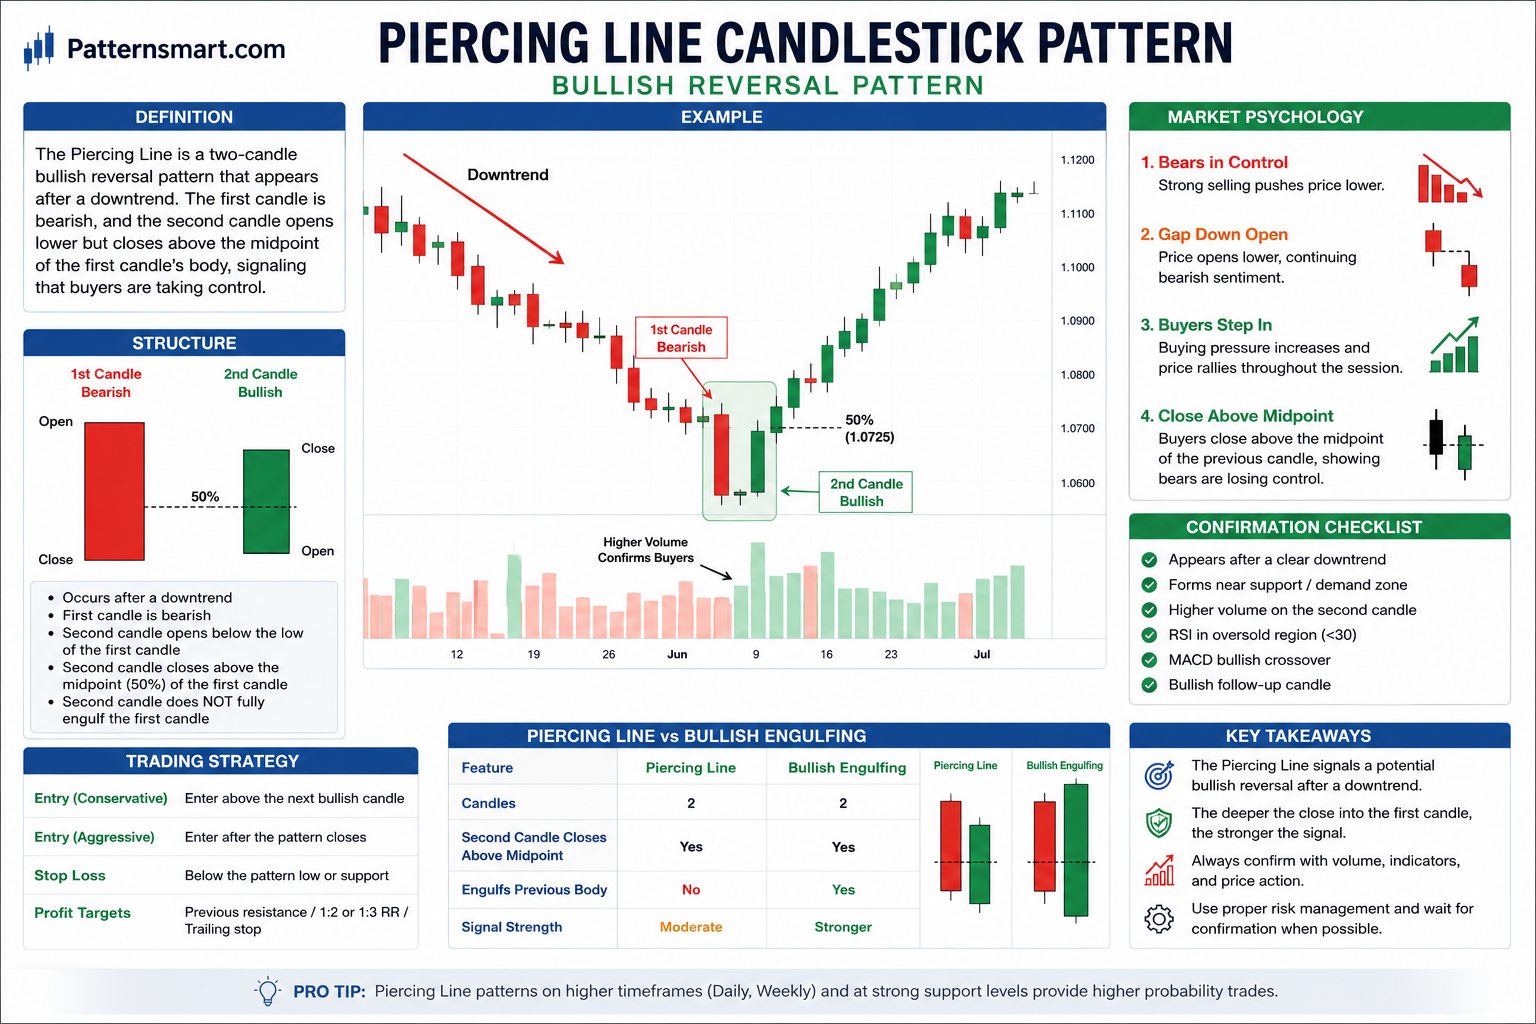
The Piercing Line is a classic bullish reversal candlestick pattern that typically appears after a sustained downtrend. It signals that selling pressure is weakening while buyers are beginning to regain control of the market. Although it consists of only two candles, the Piercing Line is widely respected among technical traders because it often marks the beginning of a short-term or even long-term bullish reversal.
The reliability of the Piercing Line increases significantly when it forms near major support levels, Fibonacci retracements, trendlines, or after an oversold reading from momentum indicators such as RSI or Stochastic Oscillator.
However, like every candlestick pattern, it should never be traded in isolation. Professional traders combine it with volume analysis, trend confirmation, support and resistance, and additional technical indicators before entering a position.
What is a Piercing Line Pattern?
A Piercing Line consists of two consecutive candlesticks:
- First Candle
- A long bearish (red/black) candle.
- Continues the existing downtrend.
- Sellers remain in complete control.
- Second Candle
- Opens below the previous candle’s low or near its close (creating a bearish gap in markets where gaps occur).
- Buyers aggressively step in.
- Closes above the midpoint of the previous bearish candle.
- Does not completely engulf the first candle.
The strong recovery during the second session indicates a significant shift in market sentiment.
Visual Structure
First Candle

Open
 │
 ███████
 ███████
 ███████
 ███████
Close

↓

Second Candle

Open (Gap Down)

      ███████
      ███████
      ███████
      ███████
Close (Above Midpoint of Candle 1)
Key characteristics:
- Appears after a downtrend
- Two-candle formation
- First candle is strongly bearish
- Second candle opens lower
- Second candle closes above the midpoint of Candle 1
- Second candle does not fully engulf Candle 1
Market Psychology Behind the Pattern
Understanding the psychology behind the Piercing Line is far more important than simply memorizing its appearance.
Stage 1 – Bears Dominate
The first candle represents strong selling pressure.
- Sellers remain confident.
- Buyers are unable to defend support.
- Fear continues to increase.
Everything still looks bearish.
Stage 2 – Gap Down Reinforces Bearish Sentiment
The second candle initially opens below the previous close.
This convinces many traders that the downtrend will continue.
At this moment:
- Bears become more aggressive.
- Weak bulls exit positions.
- Short sellers add new trades.
Market sentiment is extremely negative.
Stage 3 – Buyers Suddenly Take Control
Instead of continuing lower:
- Institutional buying appears.
- Sellers begin taking profits.
- New buyers enter aggressively.
Price rallies throughout the session.
Stage 4 – Close Above Midpoint
The second candle closes above the midpoint of the previous bearish candle.
This is the critical feature.
It demonstrates that:
- Buyers absorbed heavy selling pressure.
- Bears are losing momentum.
- Market sentiment has shifted.
Although bulls have not completely overwhelmed sellers (as they would in a Bullish Engulfing pattern), they have clearly taken back a significant portion of control.
Why the Midpoint Matters
The midpoint acts as an important psychological threshold.
If buyers can recover more than half of the previous day’s losses, it suggests that bearish momentum is fading rapidly.
The deeper the second candle penetrates into the first candle, the stronger the bullish reversal signal.
Ideal Market Conditions
The Piercing Line performs best when it appears:
- After a prolonged downtrend
- Near major support
- Near historical demand zones
- At Fibonacci retracement levels
- Around moving averages
- After oversold momentum readings
Poor locations include:
- Sideways markets
- Choppy consolidations
- Low-volume environments
- Strong bearish breakouts
Confirmation Signals
Professional traders rarely buy immediately after identifying a Piercing Line.
Instead, they wait for additional confirmation.
Useful confirmations include:
Increasing Volume
Higher volume during the second candle suggests institutional participation.
Higher volume generally strengthens the reversal signal.
RSI Oversold
An RSI below 30 combined with a Piercing Line often produces stronger reversal probabilities.
MACD Bullish Crossover
A bullish MACD crossover occurring shortly after the Piercing Line further confirms increasing upward momentum.
Stochastic Bullish Cross
A bullish crossover in the oversold region often aligns well with the Piercing Line reversal.
Support Levels
The pattern becomes considerably more reliable when it forms at:
- Horizontal support
- Weekly support
- Trendline support
- Fibonacci retracement support
Trading Strategy
Conservative Entry
Wait for:
- The next candle to close above the Piercing Line.
- Bullish momentum confirmation.
Pros:
- Higher probability
- Fewer false signals
Cons:
- Later entry
- Slightly smaller reward
Aggressive Entry
Enter immediately after the Piercing Line closes.
Pros:
- Better risk-to-reward ratio
- Earlier participation
Cons:
- Higher risk of failure
Stop Loss Placement
Common locations include:
Below the Pattern Low
The safest placement.
If price breaks below the second candle’s low, the bullish reversal has likely failed.
Below Support
If the pattern forms near a strong support zone, the stop may be placed slightly below that level.
Profit Targets
Several exit methods can be used.
Previous Resistance
Target the nearest resistance level.
Risk-Reward Ratio
Many traders aim for:
- 1:2
- 1:3
- 1:4
risk-to-reward ratios.
Trailing Stop
Ride larger trends by trailing below swing lows or a moving average.
Difference Between Piercing Line and Bullish Engulfing
| Feature | Piercing Line | Bullish Engulfing |
|---|---|---|
| Number of Candles | 2 | 2 |
| Trend | Downtrend | Downtrend |
| First Candle | Bearish | Bearish |
| Second Candle | Bullish | Bullish |
| Opens Lower | Usually | Usually |
| Closes Above Midpoint | Yes | Yes |
| Completely Engulfs Previous Body | No | Yes |
| Signal Strength | Moderate | Stronger |
Bullish Engulfing generally represents a more decisive reversal because buyers completely overcome the previous bearish candle.
Common Mistakes
Trading Inside Sideways Markets
The pattern is designed as a reversal signal.
Without a preceding downtrend, its effectiveness decreases dramatically.
Ignoring Volume
Weak volume often indicates insufficient buying commitment.
Entering Too Early
Many Piercing Lines fail without confirmation.
Waiting for the following bullish candle often improves success rates.
Ignoring Resistance
Buying directly below significant resistance reduces the potential reward.
Using It Alone
The highest-probability trades combine the pattern with:
- Trend analysis
- Support and resistance
- Volume
- RSI
- MACD
- Moving averages
- Fibonacci retracements
Advantages
- Easy to identify
- Strong psychological foundation
- Effective after extended declines
- Works across multiple markets
- Suitable for all timeframes
- Combines well with technical indicators
Limitations
- Not a guaranteed reversal
- Requires confirmation
- Less powerful than Bullish Engulfing
- Can generate false signals during strong bear markets
- Less effective in ranging conditions
Best Markets
The Piercing Line performs well in:
- Stocks
- Forex
- Cryptocurrency
- Futures
- Commodities
- ETFs
- Indices
It can be applied to:
- 5-minute charts
- 15-minute charts
- Hourly charts
- Daily charts
- Weekly charts
Higher timeframes generally produce more reliable signals.
Professional Trading Tips
Experienced traders often improve the probability of success by following these principles:
- Trade only in established downtrends.
- Prioritize patterns that form at strong technical support.
- Look for increasing buying volume on the second candle.
- Confirm the reversal with momentum indicators such as RSI, MACD, or Stochastic.
- Wait for the next candle to validate the bullish move when possible.
- Use disciplined stop-loss placement below the pattern low.
- Manage trades with predefined risk-to-reward ratios rather than relying solely on candlestick signals.
Conclusion
The Piercing Line is one of the most reliable bullish reversal candlestick patterns when it appears after a clear downtrend and in conjunction with strong technical support. Its strength lies in the dramatic shift in sentiment it represents: sellers begin the session in control, but buyers recover enough ground to reclaim more than half of the previous candle’s losses, signaling that bearish momentum is fading.
While the pattern can provide valuable early reversal signals, it should not be viewed as a standalone trading strategy. Combining the Piercing Line with volume analysis, support and resistance, trend confirmation, and momentum indicators significantly improves its effectiveness and helps filter out false signals. When incorporated into a comprehensive trading plan with sound risk management, the Piercing Line can become a powerful tool for identifying high-probability bullish reversal opportunities across stocks, forex, cryptocurrencies, futures, and other financial markets.
Please check our Bullish Patterns Indicator collection.