In technical analysis, few triple-candle formations carry as much structural weight as the Morning Star. Occurring exclusively at the terminus of a markdown phase, this bullish reversal pattern signals a definitive shift from institutional liquidation to aggressive accumulation.
When identified correctly within a broader market context, the Morning Star offers systematic traders a high-probability setup with mathematically defined risk parameters.
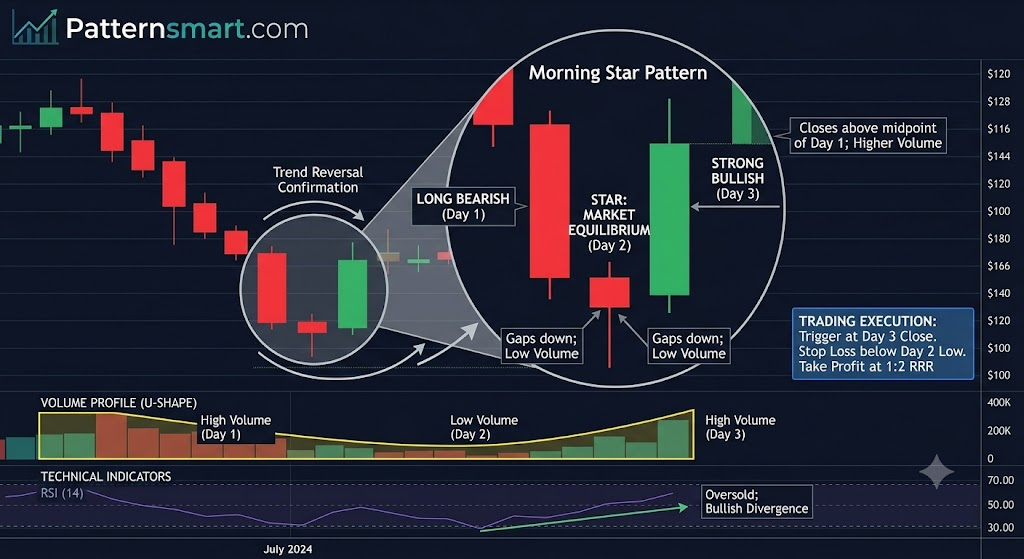
Anatomy of the Morning Star
The Morning Star is a three-bar formation that captures a complete psychological cycle: structural panic, equilibrium, and dominant expansion.
To validate the pattern for institutional-grade execution, the sequence must satisfy three strict structural criteria:
- Bar 1 (The Long Bearish Candle): A large, red (or black) candle that prints in the direction of the prevailing downtrend. This represents the final capitulation phase where sellers maintain complete control, pushing price to deep relative lows.
- Bar 2 (The Star): A small-bodied candle that ideally gaps down on open relative to Bar 1’s close. The color of the body is secondary; what matters is the restricted range. This narrow body demonstrates market equilibrium—bears are losing momentum, and bulls are actively absorbing the remaining supply.
- Bar 3 (The Long Bullish Candle): A large, green (or white) candle that opens near the Star and closes deep within the real body of Bar 1. For a standard structural validation, Bar 3’s close must exceed the 50% midpoint of Bar 1’s real body.
The Underlying Market Mechanics
Relying solely on visual patterns without understanding the underlying order flow can introduce significant tail risk. The Morning Star is essentially a lower-timeframe shift in market structure compressed into three higher-timeframe bars.
- Supply Depletion: Bar 1 represents high momentum, but it often exhausts the remaining pool of motivated sellers.
- The Liquidity Trap: The gap down into Bar 2 often triggers trailing stop-losses from retail shorts and fills sell-stop breakout orders. However, the failure of the price to expand downward reveals that institutional buyers are stepping in with limit orders, creating a floor.
- Short Covering & Momentum Shift: As Bar 3 begins to trade higher, traders who shorted the gap down are caught off-guard. Their buy-to-cover market orders cascade alongside fresh institutional long-market orders, causing the rapid upward expansion seen in the final bar.
Institutional Validation Metrics
A Morning Star printing in isolation is statistically unreliable. To filter out false positives, mechanical strategies integrate confluence metrics.
1. Volume Profile Analysis
Volume should follow a distinct “U-shape” across the three sessions:
- Bar 1: High volume (validating the final flush of supply).
- Bar 2: Substantially lower volume (confirming a drying up of selling pressure and standard consolidation).
- Bar 3: High, above-average volume (confirming institutional backing behind the reversal).
2. Structural Location
Reversals require a structural level to reverse from. A Morning Star gains significant predictive power when it prints directly at a:
- Historical key support/resistance flip zone.
- Daily or weekly Demand Zone (order block).
- Major Fibonacci retracement level (e.g., the 61.8% or 78.6% level).
- Higher-timeframe moving average (such as the 200-period EMA).
Systematic Execution Strategy
When translating the Morning Star into a concrete trading plan, execution must be completely rule-based to strip out emotional bias.
| Execution Parameter | Strategy Specification |
| Trigger Condition | Market order at the exact close of Bar 3, or a limit order placed at the 50% retracement of Bar 3’s body (for tighter risk management). |
| Stop Loss Placement | Set strictly 1–2 pips/ticks below the lowest wick of Bar 2 (the Star). If price breaches this level, the structural thesis is invalidated. |
| Take Profit Targets | Target 1 is placed at the nearest major swing high (liquidity pool). Target 2 is mapped via a 1:2 or 1:3 minimum Risk-to-Reward Ratio (RRR). |
Risk Management Note: If Bar 3 expands too aggressively and closes near the top of the entire structural move, your physical Stop Loss distance will naturally be wider. If the calculated risk exceeds your maximum risk-per-trade parameter (e.g., 1% of total account equity), the setup must be skipped or executed with scaled-down position sizing.
Please check our Bullish Patterns Indicator collection.