This is a permanent license.
Fibonacci
retracement is a method of technical analysis for determining support
and resistance levels. They are named after their use of the Fibonacci
sequence. Fibonacci retracement is based on the idea that markets will
retrace a predictable portion of a move, after which they will continue
to move in the original direction.
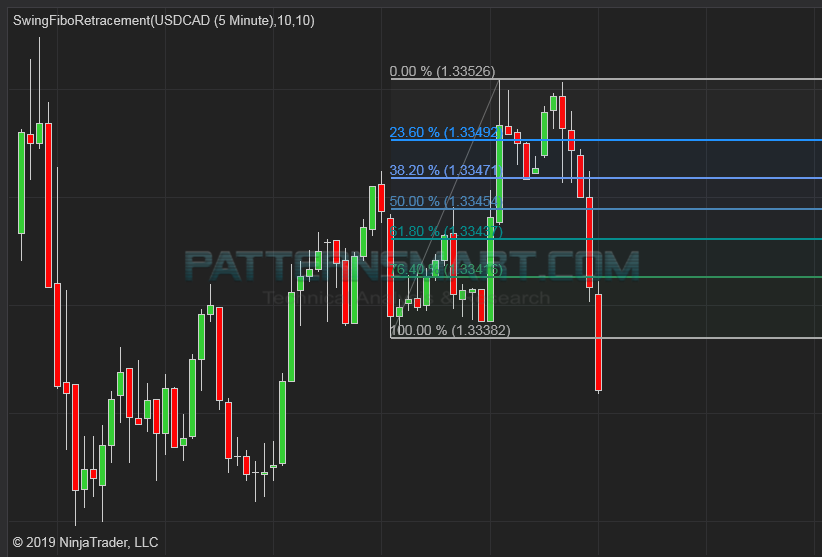
This Ninjatrader 8 indicator will plot Fibonacci extension lines automatically from
most recent Swing high & low automatically on chart.
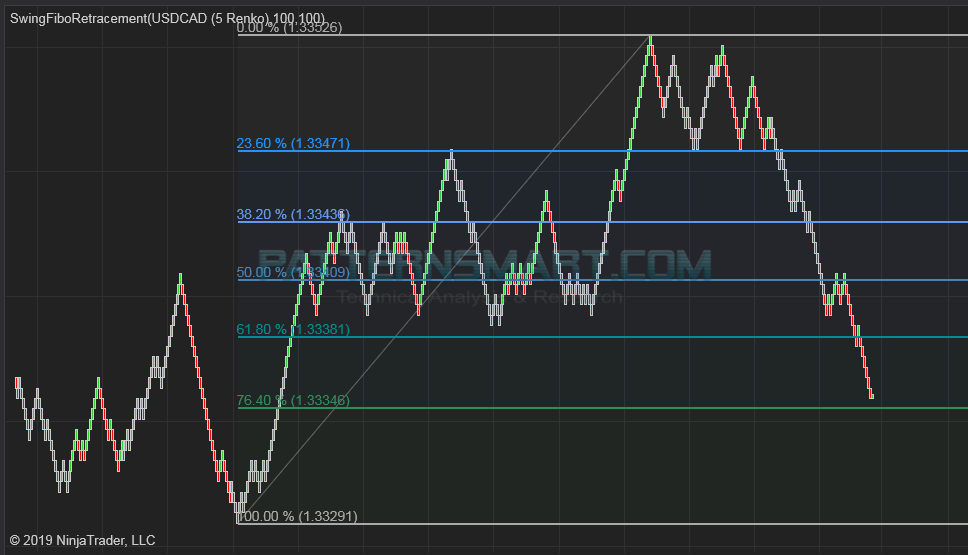
It works on any timeframe and chart type that supports swing high low, such as Renko, Heiken Ashi, Range and Tick.
The
lines of a Fibonacci retracement used Fibonacci ratios determined by the
Fibonacci series, typically 23.6 percent, 38.2 percent, 50 percent, 61.8
percent and 76.4 percent. They can be used to estimate support and
resistance levels.
Fibonacci retracement is a practical technique that uses Fibonacci ratios to draw out levels of support and resistance, It can be applied to both short-term and long-term trends, as well as to up and down trends.see chart below as an example.

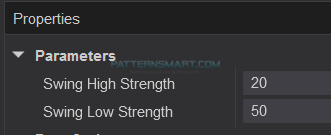
In
order to make is as simple as possible, there are only 2 inputs, which
are used to detect the most recent swing high point and swing low point.
- Strength,
it’s the number of bars used to detect the highest and lowest price.
If Strength set to 5, it means the swing high must be greater than the highs
of at least 5 bars to its left side and at least 5 bars to its right side. It can be more than 5 bars to each side of the swing point, but it cannot be less than 5.
For more info about the swing point please check: https://patternsmart.blogspot.com/2018/08/what-is-swing-point-swing-high-and.html
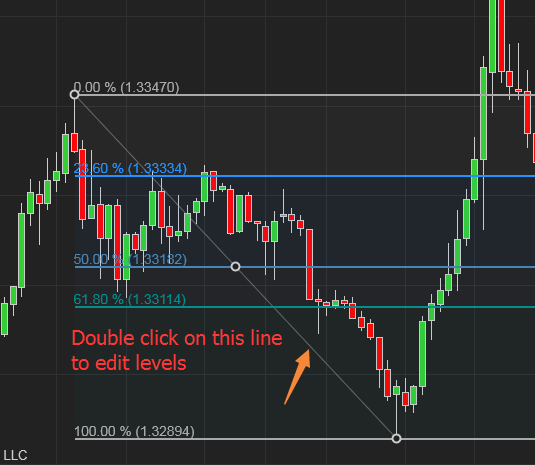
Please double click the diagonal if you want to adjust the line style of Fibonacci retracement.
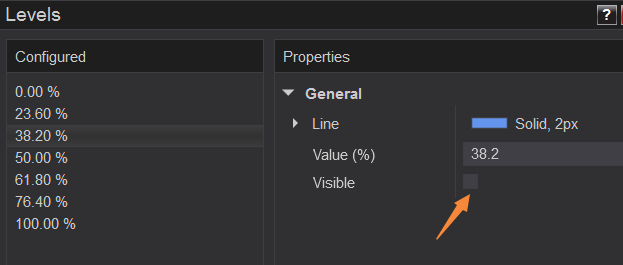
After you double click the diagonal, you should see a pop up window like this, it is the same as you change the drawing tool’s property.

You can change the style of any of the levels, you can also remove existing levels or add a new level.
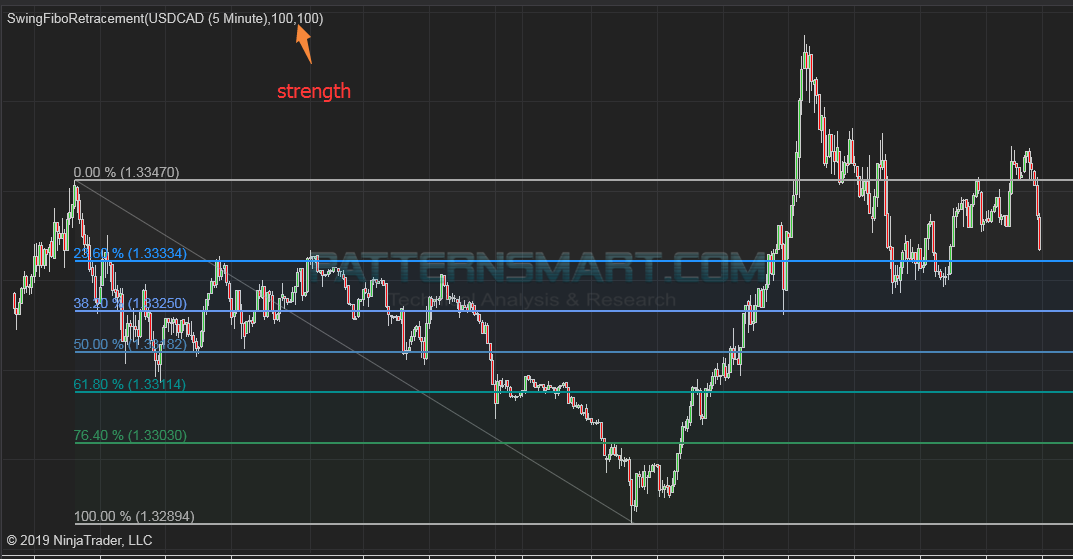
The chart below is an example of both swing high low strength inputs set to 100.
The chart below is an example of Renko bar chart.
The chart below is an example of add this indicator twice with different swing strength inputs, it’s useful when you want to check both long and short term range.
