The Belt Hold candlestick pattern (known as yorikiri in Japanese candlestick charting) is a sharp, single-candle reversal formation that signals a sudden, aggressive shift in supply and demand. It occurs when an asset opens at an extreme gap in the direction of the prevailing trend, but immediately reverses to trend powerfully in the opposite direction for the remainder of the session.
Because it represents an immediate rejection of opening prices, it often marks critical swing highs and lows where institutional liquidity has trapped retail momentum traders.
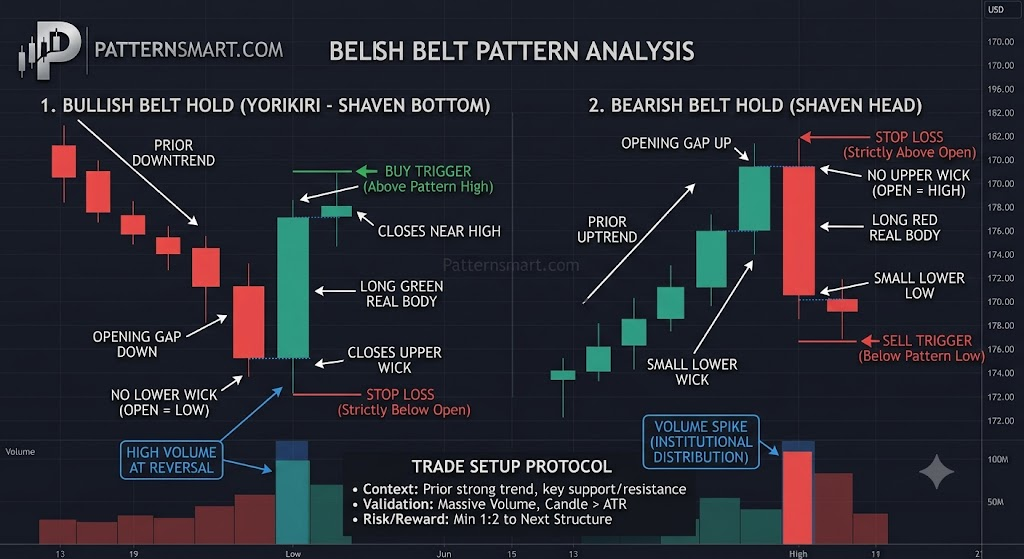
Anatomy of the Belt Hold Pattern
The defining characteristic of a Belt Hold pattern is the complete or near-complete absence of a shadow (wick) at one end of the candle, coupled with a large real body.
1. The Bullish Belt Hold (Bullish Opening Shaven Bottom)
- Prior Trend: A sustained downtrend or sharp corrective pullback.
- The Candlestick: A long, bullish (green/white) candle.
- Structural Mechanics: The asset gaps down significantly at the market open, continuing the bearish sentiment. However, the opening price marks the absolute low of the session—there is no lower wick (a “shaven bottom”). From the opening bell, buyers aggressively drive the price upward, closing near the session high and leaving only a small upper wick.
- Market Psychology: Panic selling peaks at the open, filling large institutional buy orders. The complete lack of downward follow-through catches short-sellers off guard. As prices surge intraday, shorts are forced to cover alongside new buyers stepping in, creating a rapid upward momentum shift.
2. The Bearish Belt Hold (Bearish Opening Shaven Head)
- Prior Trend: A clear, established uptrend or an overextended rally.
- The Candlestick: A long, bearish (red/black) candle.
- Structural Mechanics: The session opens with a strong gap up, hitting a fresh high. This opening price becomes the absolute high of the day, leaving no upper wick (a “shaven head”). Immediately following the open, aggressive selling pressure hammers the price lower, closing near the absolute low of the session with a minimal lower wick.
- Market Psychology: Extreme euphoria at the open is immediately met with heavy institutional distribution. Buyers who chased the opening gap find themselves instantly trapped. The relentless downward price action throughout the session signals that the bulls have completely lost control.
                  BELT HOLD STRUCTURAL CHARACTERISTICS

     [ BULLISH BELT HOLD ]                  [ BEARISH BELT HOLD ]

         Small Upper Wick                       No Upper Wick
              +--+                             +---------------+ <- OPEN
              |  |                             |               |
       +------+--+------+                      |               |
       |                |                      |               |
       |   Long Green   |                      |   Long Red    |
       |   Real Body    |                      |   Real Body   |
       |                |                      |               |
       +----------------+ <- OPEN              +-------+-------+
         No Lower Wick                                 |  |
                                                       +--+ Small Lower Wick
Technical Validation and Market Context
Like most single-candle setups, a Belt Hold requires specific structural confirmation to validate a high-probability trade.
- Candle Magnitude: The real body of the Belt Hold candle must be significantly larger than the average true range (ATR) of the preceding 10 to 14 sessions. A small candle that opens without a wick is simply market noise; a massive expansion bar represents true institutional conviction.
- The Power of the Gap: The significance of the pattern increases exponentially with the size of the opening gap. A massive gap down that instantly reverses into a Bullish Belt Hold carries far more weight than a flat open.
- Volume Expansion: The reversal must be backed by a massive surge in volume. Above-average volume indicates that large pools of institutional liquidity were swept at the open, initiating a structural trend change.
Execution Strategies
Trading the Belt Hold requires decisive entry execution because the pattern itself represents an explosive burst of momentum.
                     BEARISH BELT HOLD ENTRY PROTOCOL

         [Prior Uptrend]
              +-+      OPEN (No Upper Wick)
              | |     +---------------+ <--- STOP LOSS (Just Above Open)
           +--+--+    |               |
           |  |  |    |               |
           +--+--+    |  Long Bearish |
              | |     |  Real Body    |
              +-+     |               |
                      +-------+-------+
                              |  |
                              +--+     <--- TRIGGER (Break of Low)
                                        \
                                         v Short Entry
1. Trading the Bullish Belt Hold (Long Setup)
- Location: Price tests key horizontal support, a major moving average, or a significant Fibonacci retracement level (e.g., 61.8%).
- Entry: Enter long immediately upon the close of the Belt Hold candle, or on a minor intraday retest of the candle’s midpoint during the subsequent session.
- Stop-Loss: Positioned strictly below the opening price (the absolute low) of the Belt Hold candle. Because there is no lower wick, a violation of the open completely invalidates the setup.
- Profit Target: Target the nearest overhead resistance zone or recent swing high, maintaining a minimum 1:2 risk-to-reward ratio.
2. Trading the Bearish Belt Hold (Short Setup)
- Location: Price tests a major overhead resistance zone, a downward trendline, or prints an overbought reading on momentum oscillators (RSI > 70).
- Entry: Enter short on the close of the bearish candle, or wait for the next candle to break below its lower low.
- Stop-Loss: Placed just above the opening price (the absolute high) of the Bearish Belt Hold candle.
- Profit Target: Target the next logical liquidity pool, structural support level, or recent swing low.
Limitations and Pitfalls
- Whipsaw Risk in Ranges: In a sideways or consolidating market, Belt Holds occur frequently as price bounces between boundaries. Avoid trading this pattern unless it occurs after a prolonged, clearly defined directional trend.
- Strict Wick Discipline: If a “Bullish Belt Hold” has a noticeable lower wick, it is no longer a Belt Hold—it is a Hammer or a Dragonfly Doji. While those are also reversal patterns, they possess different mechanics. The defining power of the Belt Hold is the instant rejection right from the opening bell.
Please check our Bearish and Bullish Patterns Indicator collection.