The Breakaway candlestick pattern is a rare and complex five-candle reversal formation that maps a multi-day transition in market sentiment. Unlike sudden two-candle reversals like the Engulfing or Harami patterns, the Breakaway shows a gradual deceleration of an aggressive trend, followed by a violent final-day counter-attack that “breaks away” from the minor trend to signal a structural shift.
Because it requires five consecutive sessions to develop under strict structural rules, its appearance on a chart is uncommon but carries high technical significance.
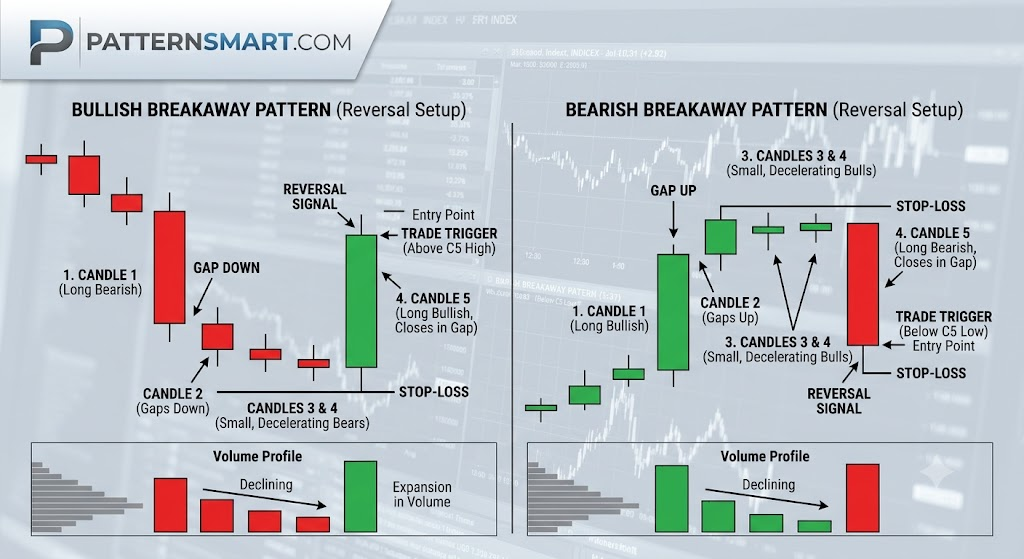
Anatomy of the Breakaway Pattern
The pattern is defined by an initial push in the direction of the dominant trend, an asset price gap, a multi-day deceleration phase, and a definitive breakout candle.
1. The Bullish Breakaway
- Prior Trend: A sustained downtrend.
- Candle 1: A long, bearish candle that reinforces the existing downward momentum.
- Candle 2: A bearish candle that opens with a distinct gap down below the close of Candle 1.
- Candles 3 & 4: Small-bodied candles that continue making lower lows or lower closes. Crucially, their downward velocity slows down significantly compared to the initial drop, revealing that selling pressure is drying up.
- Candle 5: A large, expansionary bullish candle. It must close inside the gap originally created between Candle 1 and Candle 2, completely engulfing the price action of the intermediate small candles.
2. The Bearish Breakaway
- Prior Trend: A clear, established uptrend.
- Candle 1: A long, bullish candle representing a strong upward trend climax.
- Candle 2: A bullish candle that opens with a gap up above Candle 1’s close.
- Candles 3 & 4: Small-bodied candles that continue to drift slightly higher with consecutively higher closes, though with visibly diminishing upward momentum.
- Candle 5: A long, decisive bearish candle. This candle plunges down, erasing the gains of the previous small candles, and closes firmly inside the gap area established between Candle 1 and Candle 2.
                  BULLISH BREAKAWAY PATTERN MECHANICS

      [Candle 1: Long Bearish]
             +---+
             |   |
             |   |
             +---+
                    (GAP ZONE)
                    ==========
                           +---+  [Candle 2: Gaps Down]
                           +---+
                                 +---+ [Candles 3-4: Small,
                                 +---+  Decelerating Bars]
                                        +---+
                                        +---+
                                 +--------------+  <- [Candle 5: Long Bullish,
                                 |              |      Closes In The Gap]
                                 |              |
                                 +--------------+
Market Psychology Behind the Formation
To understand the Breakaway pattern, you must read the shift in institutional positioning across the five sessions:
- Capitulation/Climax (Candle 1 & 2): The trend is moving rapidly. In a bullish breakaway, a long red candle followed by a gap down usually marks a panic-driven capitulation where retail traders throw in the towel.
- Absorption Phase (Candles 3 & 4): Despite the gap, the asset fails to fall further with any real velocity. Smart money starts absorbing the remaining sell orders. Price creeps slightly lower, but the small real bodies show that supply and demand are balancing out.
- The Trapping Event (Candle 5): Seeing that the market has run out of sellers, buyers step in aggressively. The long fifth candle catches late-entering short-sellers completely off-guard, forcing them to cover rapidly and fueling the reversal momentum.
Technical Validation and Strategy
Because this pattern plays out over a five-day sequence, it gives traders ample time to look for structural alignment.
Volume Profiling
Volume is the single most critical filter for validating a Breakaway pattern:
- Candle 1 and 2 should show elevated volume due to high trend momentum.
- Candles 3 and 4 must print on noticeably declining volume, confirming a lack of institutional commitment to keep pushing the original trend.
- Candle 5 requires an expansion in volume. A low-volume fifth candle suggests a weak short-covering bounce rather than a true trend reversal.
Execution Rules
| Metric | Long Setup (Bullish Breakaway) | Short Setup (Bearish Breakaway) |
| Market Location | Significant swing low, major support, or oversold RSI/MACD. | Significant swing high, major resistance, or overbought RSI/MACD. |
| Trigger Entry | Next candle breaks and closes above the high of the 5th candle. | Next candle breaks and closes below the low of the 5th candle. |
| Stop-Loss | Placed just below the lowest low of the entire 5-candle cluster. | Placed just above the highest high of the entire 5-candle cluster. |
| Profit Target | Next major horizontal resistance zone or 1:2 Risk-to-Reward. | Next major horizontal support zone or 1:2 Risk-to-Reward. |
Structural Pitfalls to Avoid
- Mind the Gap: In continuous 24-hour markets like Spot Forex, physical gaps between Candle 1 and Candle 2 are rare. If trading Forex, look for a severe intraday extension on Candle 2 that fails to carry forward on Candles 3 and 4, functioning as a “pseudo-gap”. Physical gaps remain mandatory for equities and index futures.
- Failure to Close the Gap: If Candle 5 fails to recover deep enough to close inside the gap zone between Candle 1 and 2, the pattern is invalid. It should be treated as a bearish continuation flag rather than a reversal.
Please check our Bearish and Bullish Patterns Indicator collection.