Breakout and Retest Trading: How to Separate Acceptance from a False Break
A price move beyond resistance is an observation, not proof that a new trend has begun. A breakout-and-retest framework asks three separate questions: Did price move beyond a meaningful level? Did trading subsequently accept prices on the other side? Does the potential reward justify the invalidation distance?
1. Identify a defensible level
Resistance is usually a zone rather than an exact tick. Map the area using repeated reactions, swing highs, or a consolidation boundary, while avoiding a level drawn only after seeing the eventual outcome. More tests do not guarantee a stronger level: repeated attacks can also consume resting liquidity.
2. Define the breakout before it happens
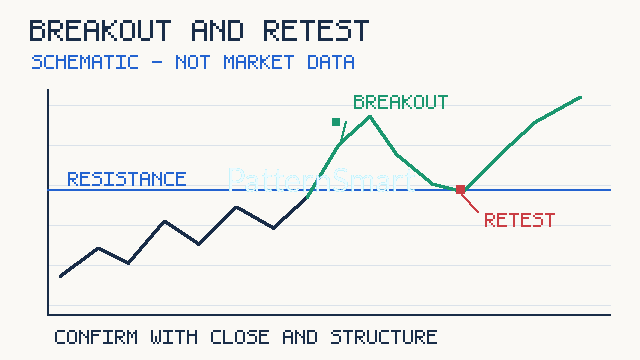
A close beyond the zone is more informative than a temporary intrabar excursion, but even a close can reverse. For example, suppose a hypothetical instrument has a resistance zone from 99.50 to 100.00. A candle closes at 100.40. This meets a predeclared closing-break condition; it does not establish a profitable trade. A trader may additionally require expansion in range or volume, but volume quality varies by market and venue.
3. Interpret the retest without hindsight
After the close above 100.00, imagine a pullback into 99.80–100.10 followed by a candle closing at 100.25. This is a possible retest-and-rejection sequence. It is not automatically confirmation: the trader should specify in advance whether a wick, a close back above the zone, or a higher low is required. A fast market may never retest; chasing it is a separate strategy with different risk.
4. Write the invalidation and position size first
Assume a hypothetical entry at 100.25, a stop at 99.20, and an initial objective at 102.35. Risk per unit is 100.25 − 99.20 = 1.05. Potential gross reward is 102.35 − 100.25 = 2.10, so the illustrative gross reward-to-risk ratio is 2.0. If the trader budgets 105 units of account currency for the trade, the theoretical position is 105 / 1.05 = 100 units, before commissions, slippage, contract multipliers, and any lot-size constraints. A stop order is not a guarantee of execution at the specified price.
5. Confirmation and failure conditions
| Observation | Interpretation | Caution |
|---|---|---|
| Close above the prior zone | Initial breakout criterion met | Can still be a false break |
| Pullback holds near former resistance | Possible role reversal | Zone width and timeframe matter |
| Higher low and renewed upward close | Potential continuation confirmation | Entry may become less attractive |
| Repeated closes back inside the range | Acceptance above the level is in doubt | Do not move the invalidation arbitrarily |
6. Multi-timeframe context
A breakout on a five-minute chart can occur directly beneath a daily resistance zone. Start with a higher timeframe to identify the broader structure, then use the execution timeframe for the entry and stop logic. Do not mix a daily target with a tiny intraday stop without accounting for normal intraday volatility. Define whether the signal requires completed candles to avoid intrabar look-ahead.
7. Common mistakes
Typical errors include treating every wick beyond resistance as a confirmed break, redrawing zones after the fact, ignoring transaction costs, choosing a stop solely to manufacture a favorable reward-to-risk ratio, and assuming that a retest must occur. A breakout with strong momentum may continue without revisiting the level; a tidy-looking retest may fail immediately.
8. A testable research checklist
Record the zone construction rule, breakout close threshold, permitted retest window, confirmation candle, stop placement, exit policy, session, and costs. Test separately across trending and ranging periods, including failed signals. Compare performance against a simple baseline and use out-of-sample data before treating the setup as useful. A high win rate alone says little without payoff distribution and drawdown.
Practical implementation
The educational idea can be converted into an alert that marks candidate breakouts and potential retests, but any automated version needs explicit rules for zone width, bar completion, and failure handling. For assistance translating such requirements into a platform-specific indicator, see Custom Trading Software Development Services.
Risk disclaimer
This article is for education, not individualized investment advice. All prices and calculations are hypothetical. Breakouts can fail, stops can slip, and leverage can magnify losses. Validate any approach independently and use risk limits appropriate to your circumstances.