MultiCharts PowerLanguage Range Breakout Indicator with Relative-Volume Confirmation
A new high above the last 20 bars may be meaningful or merely a thin-liquidity spike. This free classic MultiCharts PowerLanguage indicator marks a first confirmed closing breakout of a prior price range only when volume is sufficiently elevated compared with the previous completed bars. It operates as a chart indicator; it does not place orders or evaluate position sizing.
Three independent checks
Price structure: the upper threshold is the highest high of bars t−20 to t−1, while the lower threshold is the lowest low of the same interval. Neither includes the current candle. First cross: a bullish bar must close above its own prior-high threshold, with the preceding close at or below that preceding bar's own prior-high threshold. The short direction mirrors this. Volume: current volume must reach at least r × mean(volume of the prior 20 bars), where r defaults to 1.30. Using a historical-only denominator prevents the same signal candle from diluting its baseline.
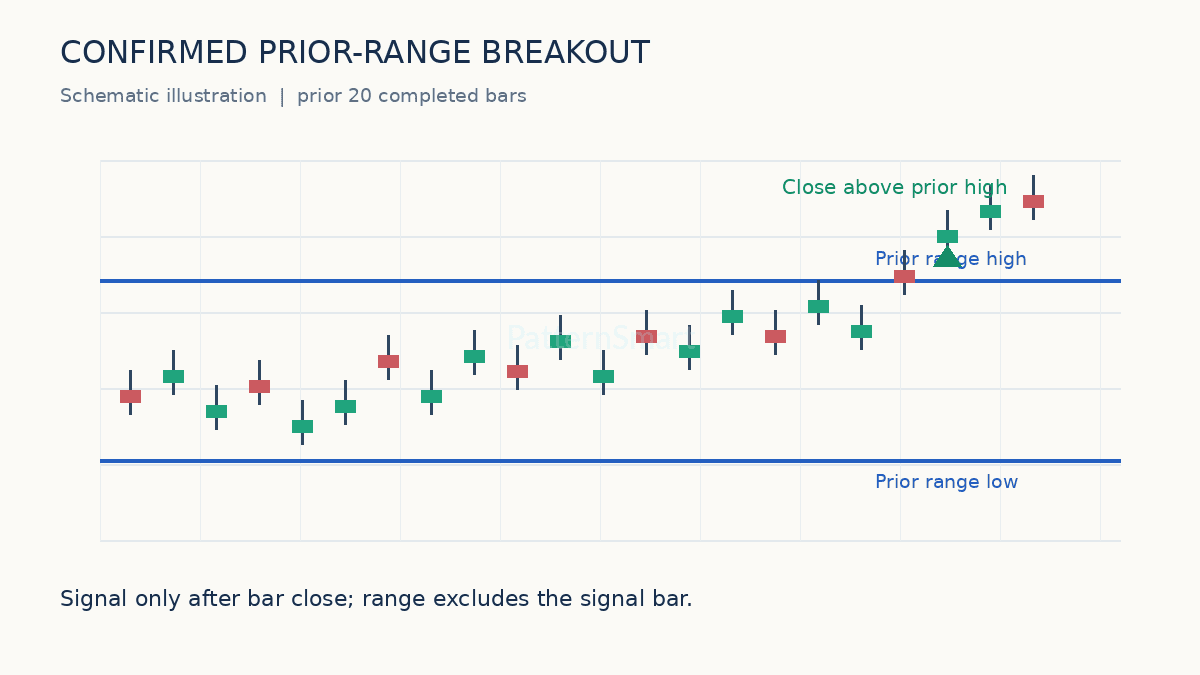
Configuration
| Input | Default | Meaning |
|---|---|---|
| RangeLength | 20 | Earlier bars forming the price bounds |
| VolumeLength | 20 | Earlier bars forming average volume |
| MinimumVolumeRatio | 1.30 | Required relative-volume threshold |
| MarkerTicks | 3 | Plot marker offset based on symbol tick size |
| EnableAlerts | True | Request configured MultiCharts indicator alerts |
Example: if the prior high is 200.00 and past average volume is 80,000, an up-break close of 200.40 with volume 118,000 passes the 104,000 threshold (1.30 × 80,000). It is a first upside signal only if the preceding bar's close was not already above its own upper boundary. Prices and volume here are entirely illustrative.
Complete PowerLanguage study
Paste the full code below into a new Indicator in PowerLanguage Editor. It uses classic PowerLanguage syntax, not the C# API for MultiCharts .NET. Plot1 and Plot2 show levels; Plot3 and Plot4 mark qualifying closed-bar events. Configure plot styles as points or symbols if desired.
{ PS Prior-Range Breakout with Relative Volume
  MultiCharts classic PowerLanguage indicator; chart study only. }

Inputs:
    RangeLength(20),
    VolumeLength(20),
    MinimumVolumeRatio(1.30),
    MarkerTicks(3),
    EnableAlerts(True);

Variables:
    PriorHigh(0),
    PriorLow(0),
    PreviousHigh(0),
    PreviousLow(0),
    AveragePriorVolume(0),
    UpperBreak(False),
    LowerBreak(False),
    EnoughVolume(False),
    TickDistance(0);

{ A prior-period reference needs an extra bar for first-cross testing. }
If CurrentBar > MaxList(RangeLength + 2, VolumeLength + 2) Then
Begin
    PriorHigh = Highest(High[1], RangeLength);
    PriorLow = Lowest(Low[1], RangeLength);
    PreviousHigh = Highest(High[2], RangeLength);
    PreviousLow = Lowest(Low[2], RangeLength);

    AveragePriorVolume = Average(Volume[1], VolumeLength);
    EnoughVolume = AveragePriorVolume > 0 And
                   Volume >= MinimumVolumeRatio * AveragePriorVolume;

    UpperBreak = Close > PriorHigh And Close[1] <= PreviousHigh;
    LowerBreak = Close < PriorLow And Close[1] >= PreviousLow;

    Plot1(PriorHigh, "PriorHigh");
    Plot2(PriorLow, "PriorLow");
    NoPlot(3);
    NoPlot(4);

    TickDistance = MarkerTicks * MinMove / PriceScale;

    { BarStatus(1)=2 means the current chart bar has completed. }
    If BarStatus(1) = 2 And EnoughVolume Then
    Begin
        If UpperBreak Then
        Begin
            Plot3(Low - TickDistance, "UpBreak");
            If EnableAlerts Then
                Alert("Confirmed upside range breakout with volume");
        End;

        If LowerBreak Then
        Begin
            Plot4(High + TickDistance, "DownBreak");
            If EnableAlerts Then
                Alert("Confirmed downside range breakout with volume");
        End;
    End;
End
Else
Begin
    NoPlot(1);
    NoPlot(2);
    NoPlot(3);
    NoPlot(4);
End;
How to install and test
- Open the PowerLanguage Editor, create a new Indicator, paste the entire listing and use Verify to compile for your installed MultiCharts version.
- Attach the study to a chart with adequate history. Set the first two plots as visible lines and the marker plots as dots or other suitable styles.
- For email or sound notifications, enable indicator alerts in the study's chart settings;
Alert()by itself does not configure a delivery destination. - On a set of completed bars, hand-check the highest high, lowest low, prior volume average, and first-cross requirement.
- Compare end-of-bar behavior with an intrabar-updated chart, and test market sessions, low-volume periods and gap openings.
Repainting, limitations, risk
BarStatus(1) = 2 gates markers to completed primary-series bars. Historical plotted thresholds can still change while the current live bar is forming; plotted threshold changes are not final trade signals. Alert behavior depends on chart update and alert settings. Volume scales differ among markets; on some feeds it is tick volume rather than centrally reported exchange volume. A high ratio can filter early trends and still admit false breaks. The source has not been compiled in your installation. This educational indicator is not an execution model or a guarantee of returns; validate with real spreads, commissions, slippage, session hours and out-of-sample testing.
Interested in adding personalized alert rules, a scanner or a strategy to this free indicator? Our Custom Trading Software Development Services can discuss the implementation.