ProRealTime ATR-Buffered Range Breakout: Free ProBuilder Indicator with Confirmed Arrows
A conventional range high may be crossed by just a few ticks, especially when market volatility is high. This free ProRealTime ProBuilder indicator extends earlier range highs and lows by a fraction of Average True Range (ATR) and marks an event only when a fully completed candle closes beyond its threshold. It is a custom chart indicator, not a ProOrder trading system.
Exact calculations
Let H(t) be the highest high of the N bars ending at t−1, and L(t) the lowest low of those N bars. Let A(t−1) be the prior completed ATR value, calculated using the platform's built-in AverageTrueRange function (Wilder-style smoothing). Upper(t) = H(t) + m × A(t−1); Lower(t) = L(t) − m × A(t−1). A first long cross requires Close(t) > Upper(t) and Close(t−1) ≤ Upper(t−1); a first short cross requires Close(t) < Lower(t) and Close(t−1) ≥ Lower(t−1).
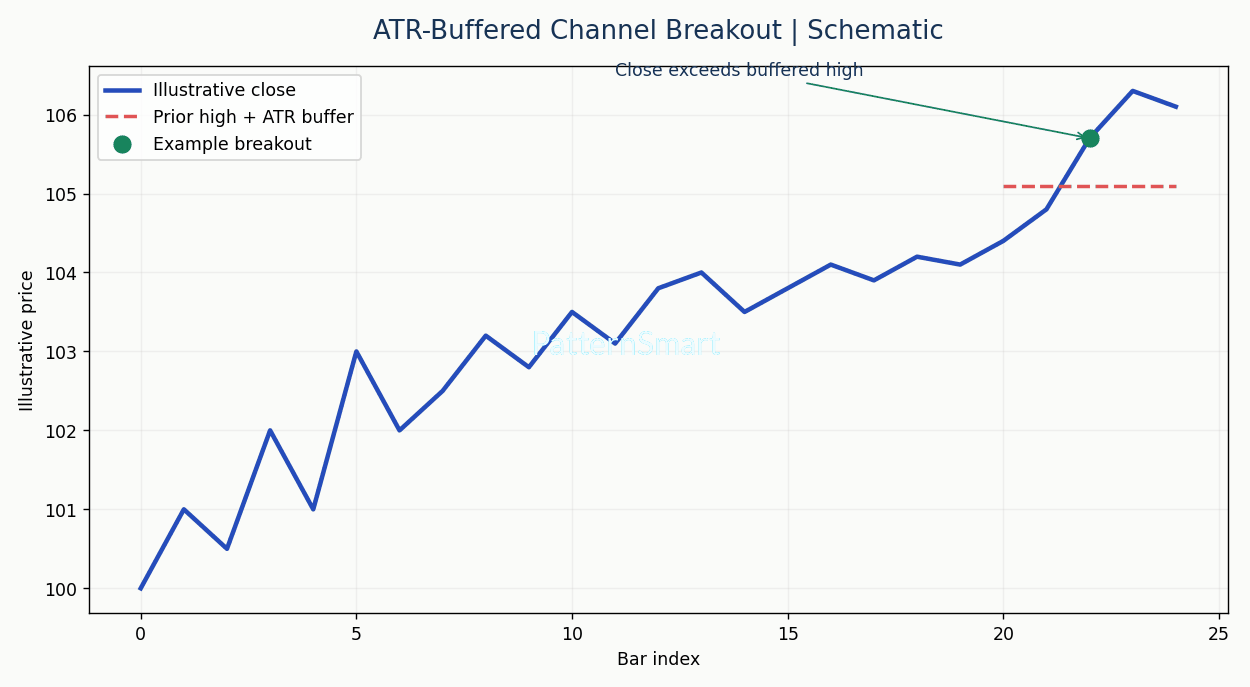
Why the code evaluates bars 1 and 2
A ProBuilder indicator can be recalculated while the current candle is forming. If an arrow were placed immediately from close, it could appear and vanish before the bar finished. The provided code instead checks close[1] and close[2], which are completed candles relative to the live bar, and draws an arrow on barindex[1]. The channel lines shown for the current bar use only prior-bar inputs; they are chart reference levels, not orders.
Inputs and illustrative example
| Variable | Default | Meaning |
|---|---|---|
| rangeLength | 20 | Number of prior high/low bars |
| atrPeriod | 14 | ATR calculation period |
| atrMultiplier | 0.30 | Volatility buffer factor |
| arrowTicks | 3 | Marker separation in instrument tick units |
Suppose the previous 20-bar high is 152.00 and completed ATR equals 1.80. With m = 0.30, the long trigger is 152.54. A bar that completes at 152.70 satisfies that price test, but only the first crossing produces a signal; if its predecessor already closed above its own upper line, it is not a fresh long setup. These hypothetical numbers do not represent real markets.
Complete ProBuilder indicator source
This listing is for ProRealTime indicator creation. It uses Highest[N], Lowest[N], AverageTrueRange[N], historical brackets, drawing functions and RETURN. It does not submit trades.
// ProRealTime / ProBuilder
// Closed-bar ATR-buffered breakout of prior price range.
// Free chart indicator: no automated orders.

rangeLength = 20
atrPeriod = 14
atrMultiplier = 0.30
arrowTicks = 3

// Wilder ATR is calculated by ProBuilder's built-in function.
atrValue = AverageTrueRange[atrPeriod](close)

// The range excludes the currently evaluated candle.
priorHigh = Highest[rangeLength](high[1])
priorLow = Lowest[rangeLength](low[1])

// Completed ATR prevents the live candle changing the buffer size.
upperTrigger = priorHigh + atrMultiplier * atrValue[1]
lowerTrigger = priorLow - atrMultiplier * atrValue[1]

// Confirm signals only on bar [1] once the next candle exists.
// A first cross requires bar [2] on the opposite side of its own line.
IF barindex > rangeLength + atrPeriod + 4 THEN
    longConfirmed = close[1] > upperTrigger[1] AND close[2] <= upperTrigger[2]
    shortConfirmed = close[1] < lowerTrigger[1] AND close[2] >= lowerTrigger[2]

    IF longConfirmed THEN
        DRAWARROWUP(barindex[1], low[1] - arrowTicks * pipsize) COLOURED(0, 150, 110)
    ENDIF

    IF shortConfirmed THEN
        DRAWARROWDOWN(barindex[1], high[1] + arrowTicks * pipsize) COLOURED(200, 65, 78)
    ENDIF
ENDIF

RETURN upperTrigger AS "Upper ATR Trigger" COLOURED(35, 89, 176), lowerTrigger AS "Lower ATR Trigger" COLOURED(200, 65, 78)
Install and validation workflow
- In ProRealTime, open the Indicators interface, create a new personal indicator and paste the full ProBuilder program.
- Save, check the built-in editor's error messages and add the study to a price chart. Select the price panel if the platform offers the choice.
- Use default 20/14/0.30/3 initially. Cross-check manually calculated prior highs and ATR on several historical bars.
- Observe an intrabar high beyond the line followed by a close back inside: no final historical arrow should be committed for that incomplete candle.
- Check that a new arrow is displayed on the previously completed candle once the following bar exists, and inspect changes after a full data reload.
Limitations and risk
An ATR buffer is a volatility filter, not a guarantee of a trend. It may create fewer signals as volatility rises, even during strong momentum. The last live bar and the platform's initial-history warmup can change how much context is available; examine signal timing carefully. Data gaps, session transitions and spreads can cause the marked threshold to differ from tradable fills. This code has not been compiled on your ProRealTime version and must be inspected there. Study historical and real-time behavior, run out-of-sample checks, and include slippage, fees and risk limits before using any derived trading strategy. Educational purpose only.
Want to adapt this free indicator or add custom alerts and strategy logic? Our Custom Trading Software Development Services is available to discuss your needs.