While reversal configurations like the Morning Star or Inverted Hammer capture significant retail attention, systematic trend-following strategies rely heavily on continuation structures to maximize exposure during a sustained markup phase. The High Price Gapping Play is a premier bullish continuation pattern that charts an intentional, institutional pause within an aggressive uptrend before explosive expansion resumes.
When identified correctly within an established trend structure, this pattern provides algorithmic and discretionary traders with a high-probability entry mechanism that avoids the danger of chasing extended markets.
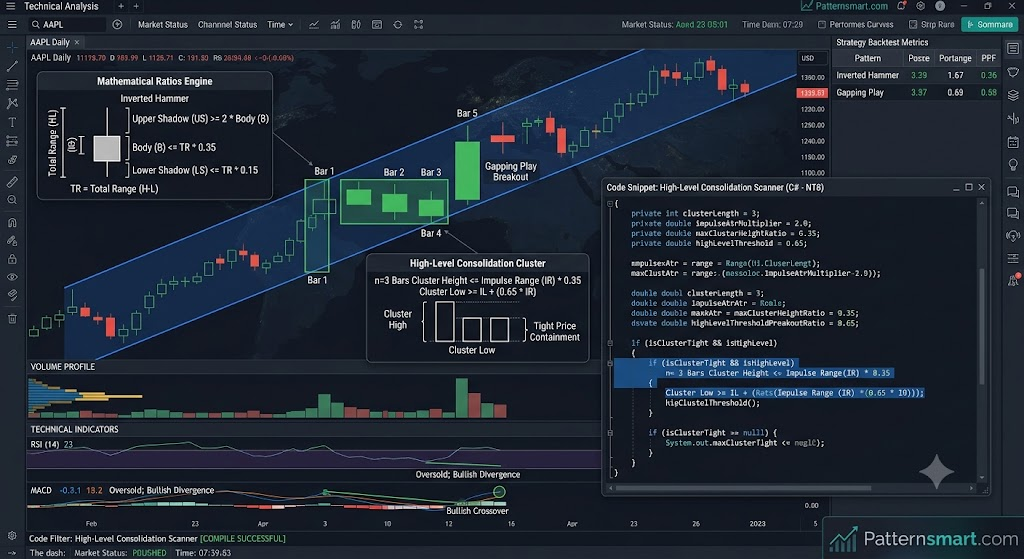
Anatomy of the High Price Gapping Play
The High Price Gapping Play is a multi-bar formation occurring exclusively during an active uptrend. It maps a distinct psychological cycle: aggressive buying, a controlled structural pause (supply absorption), and a sudden breakout gap that traps late-stage shorts and sideline buyers.
       [Bar 5]
        ───
       │   │   <- Explosive Breakout
        ───
       ====    <- The Gap
   ─── ─── ───
  │   │   │   │ <- Bars 2-4: Tight, High-Level Consolidation
   ─── ─── ───
 ───
│   │          <- Bar 1: Strong Bullish Drive
 ───
To validate this formation for institutional-grade execution, the structure must strictly adhere to four criteria:
- Bar 1 (The Initial Impulse): A large, green (bullish) candle that prints on expanding volume, confirming strong upside momentum and established institutional buying.
- Bars 2 to 4 (The High-Level Consolidation): A series of small-bodied candles (typically 2 to 5 bars) that trade horizontally near the absolute highs of Bar 1. These candles can be a mix of red or green, but crucially, they must not experience significant retracement. Price must remain flagged at the top of the initial impulse wave.
- The Gapping Trigger (Bar 5): The final bar opens with a distinct, clean upward gap relative to the consolidation cluster of the preceding days.
- The Expansion Close: Bar 5 must close as another strong, expanding green candle, validating the breakout and completing the pattern.
The Underlying Market Mechanics
Evaluating this pattern through the lens of order flow reveals why it represents one of the most reliable continuation structures in technical analysis:
- Absence of Profit-Taking: Following a major upward drive (Bar 1), a standard market typically experiences a corrective retracement as early buyers take profits. In a High Price Gapping Play, the fact that price moves sideways rather than down indicates an extreme imbalance of supply and demand—buyers are holding their positions, and fresh limit orders are absorbing any minor selling pressure at the highs.
- The Sideline Trap: During the multi-day consolidation, retail traders often anticipate a double-top or an overextended reversal, entering premature short positions. Meanwhile, cautious buyers wait for a pullback that never arrives.
- The Order-Book Vacuum: The upward gap on the final bar bypasses the overhead liquidity entirely. This sudden jump instantly forces trapped short-sellers to buy to cover via market orders, while simultaneously triggering institutional buy-stop breakout orders. This dual-source buying pressure fuels the rapid expansion of the final candle.
Technical Validation & Filters
To filter out false breakouts and “bull traps,” systematic execution systems deploy two core confirmation metrics:
1. Volume Profile Behavior
Volume should print a highly specific structural signature across the pattern:
- Bar 1: Above-average volume confirming the legitimacy of the initial impulse.
- Consolidation Bars: A steep, cascading drop in volume. This low volume during the pause confirms that no major institutional liquidation is taking place.
- The Breakout Bar: A massive surge in volume (ideally $> 150\%$ of the 20-period volume average), validating the capital commitment behind the gap.
2. Relative Strength Index (RSI) Behavior
Because this pattern occurs in an aggressive uptrend, the RSI will frequently be in “Oversold” territory ($>70$). While retail indicators flag this as a warning to sell, an institutional continuation strategy views a high-level RSI consolidation (where the RSI holds above 60 while price moves sideways) as a sign of immense trend strength rather than exhaustion.
Systematic Execution Strategy
To execute this continuation setup without emotional bias, traders must deploy a strict, rule-based framework.
| Execution Parameter | Strategy Specification |
| Trigger Condition | Market entry at the exact close of the breakout candle (Bar 5), provided the gap remains open and unfilled at the session close. |
| Stop Loss Placement | Placed strictly below the lowest low of the high-level consolidation cluster (Bars 2-4). Alternatively, for tighter risk, just below the opening print of Bar 5. |
| Take Profit Targets | Measured Move Method: Calculate the height of the initial impulse (Bar 1) and project that exact distance upward from the close of Bar 5. Target a minimum 1:2 Risk-to-Reward Ratio (RRR). |
Please check our Bullish Patterns Indicator collection.
To mathematically isolate a high-level consolidation cluster (the tight, horizontal pause following a massive impulse wave in patterns like the High Price Gapping Play), an algorithm cannot rely on visual intuition. Instead, it must define three core metrics: momentum expansion (the flagpole), price containment (the flag), and structural location (the high-level constraint).
Here is the mathematical framework and the corresponding production-ready C# implementation for NinjaTrader 8.
The Mathematical Framework
Let $n$ be the number of bars chosen to represent the consolidation cluster length (typically $2 \le n \le 5$). We evaluate the cluster ending at the bar immediately preceding our breakout candle ($Bar[1]$).
1. Impulse Wave Definition (The Flagpole)
Before a high-level consolidation can exist, there must be an aggressive upward move. We define this by ensuring the true range of the impulse bar ($Bar[n+1]$) is a multiple of the market’s recent volatility.
$$\text{Range}_{n+1} = \text{High}_{n+1} – \text{Low}_{n+1} \ge K \times \text{ATR}(14)_{n+1}$$
(Where $K$ is a multiplier, typically between 1.5 and 2.5)
2. Tight Price Containment (The Flag)
To ensure the consolidation is trading horizontally rather than retracing or expanding wildly, the absolute highest high and lowest low of the entire $n$-bar cluster must be tightly restricted. We define this using a maximum threshold percentage (e.g., within 1.5% of the asset’s price) or by anchoring it to a fraction of the impulse bar’s range.
$$\text{Cluster High} = \max_{i=1}^{n}(\text{High}_i)$$
$$\text{Cluster Low} = \min_{i=1}^{n}(\text{Low}_i)$$
$$\text{Cluster Height} = \text{Cluster High} – \text{Cluster Low} \le (\text{High}_{n+1} – \text{Low}_{n+1}) \times 0.35$$
(This ensures the total height of the consolidation does not exceed 35% of the impulse bar’s height).
3. High-Level Constraint (No Deep Retracement)
To prove that buyers are defending the highs, the lowest point of the cluster ($\text{Cluster Low}$) must remain safely within the upper quadrant of the impulse bar.
$$\text{Cluster Low} \ge \text{Low}_{n+1} + \left(0.65 \times (\text{High}_{n+1} – \text{Low}_{n+1})\right)$$
NinjaTrader 8 C# Implementation
The following code checks a 3-bar consolidation cluster immediately following a major bullish impulse bar.
C#
using System;
using System.Linq;
using NinjaTrader.NinjaScript;
using NinjaTrader.Data;

namespace NinjaTrader.NinjaScript.Indicators
{
    public class HighLevelConsolidationScanner : Indicator
    {
        // Parameter settings for optimization
        private int clusterLength = 3;           // 'n' bars in consolidation
        private double impulseAtrMultiplier = 2.0; // How significant the impulse bar must be
        private double maxClusterHeightRatio = 0.35; // Cluster height cannot exceed 35% of impulse
        private double highLevelThreshold = 0.65;    // Cluster must stay in upper 65% of impulse

        private ATR atr;

        protected override void OnStateChange()
        {
            if (State == State.SetDefaults)
            {
                Name = "High-Level Consolidation Scanner";
                CalculateOnBarClose = true;
                IsOverlay = true;
            }
            else if (State == State.DataLoaded)
            {
                atr = ATR(14); // Initialize Average True Range for volatility filtering
            }
        }

        protected override void OnBarUpdate()
        {
            // Ensure we have enough bars to look back at the pattern structure
            int totalLookback = clusterLength + 2;
            if (CurrentBar < totalLookback || CurrentBar < 15) return;

            // Index offsets:
            // Bar[0] = The current active setup/potential breakout bar
            // Bar[1] to Bar[clusterLength] = The consolidation cluster
            // Bar[clusterLength + 1] = The initial impulse bar

            int impulseIndex = clusterLength + 1;

            // 1. Calculate Impulse Bar Metrics
            double impulseHigh  = High[impulseIndex];
            double impulseLow   = Low[impulseIndex];
            double impulseRange = impulseHigh - impulseLow;
            bool isImpulseBullish = Close[impulseIndex] > Open[impulseIndex];

            // Validate the impulse bar expanded past normal volatility
            bool isImpulseValid = isImpulseBullish && (impulseRange >= (atr[impulseIndex] * impulseAtrMultiplier));
            if (!isImpulseValid) return;

            // 2. Calculate Cluster Dimensions
            double clusterHigh = double.MinValue;
            double clusterLow  = double.MaxValue;

            for (int i = 1; i <= clusterLength; i++)
            {
                if (High[i] > clusterHigh) clusterHigh = High[i];
                if (Low[i] < clusterLow)   clusterLow  = Low[i];
            }
            double clusterHeight = clusterHigh - clusterLow;

            // 3. Mathematical Condition Testing
            // Rule A: Is the cluster tightly compressed relative to the impulse drive?
            bool isClusterTight = clusterHeight <= (impulseRange * maxClusterHeightRatio);

            // Rule B: Did the cluster remain near the absolute highs of the impulse wave?
            double structuralFloor = impulseLow + (impulseRange * highLevelThreshold);
            bool isHighLevel = clusterLow >= structuralFloor;

            // 4. Trigger Plotting / Execution Signal
            if (isClusterTight && isHighLevel)
            {
                // Highlight the background of the consolidation bars
                for (int i = 1; i <= clusterLength; i++)
                {
                    BackBrushes[i] = System.Windows.Media.Brushes.DarkGreen;
                }

                // Signal to your execution engine that conditions are primed for an upward gap breakout
                Log(string.Format("High-Level Consolidation Confirmed at bar {0}. Awaiting Gapping Play confirmation.", CurrentBar), LogLevel.Information);
            }
        }
    }
}
Architectural Implementation Tips
- Adapting for Breakout Scans: To complete the High Price Gapping Play logic, add a condition evaluating
Bar[0]. Check ifOpen[0] > clusterHigh(the gap) andClose[0] > Open[0](the bullish expansion). - Execution Safety: In highly fragmented markets, ensure your algorithm reads the cluster height against the spread. If the cluster height compresses too close to the average bid-ask spread or standard asset noise, it could trigger false positives on zero-liquidity periods. Add a baseline filter ensuring
clusterHeight >= TickSize * 3.