Analyze Buying and Selling Pressure Through Structured Market Participation Analysis
Price tells you where the market has moved. It does not always tell you how strongly market participants supported that movement.
A market can continue making new highs while buying pressure begins to weaken. Likewise, price may continue declining even as selling pressure loses strength. These situations can create an important difference between price movement and the underlying participation supporting that movement.
MoneyFlow Double Divergence Pro for MultiCharts brings the PatternSmart Double Divergence methodology to Money Flow analysis, providing a structured way to examine buying pressure, selling pressure, capital flow, and market participation alongside price action.
Rather than treating divergence as a prediction of what price must do next, the indicator provides additional technical evidence that can help traders evaluate the quality and sustainability of an existing market move.
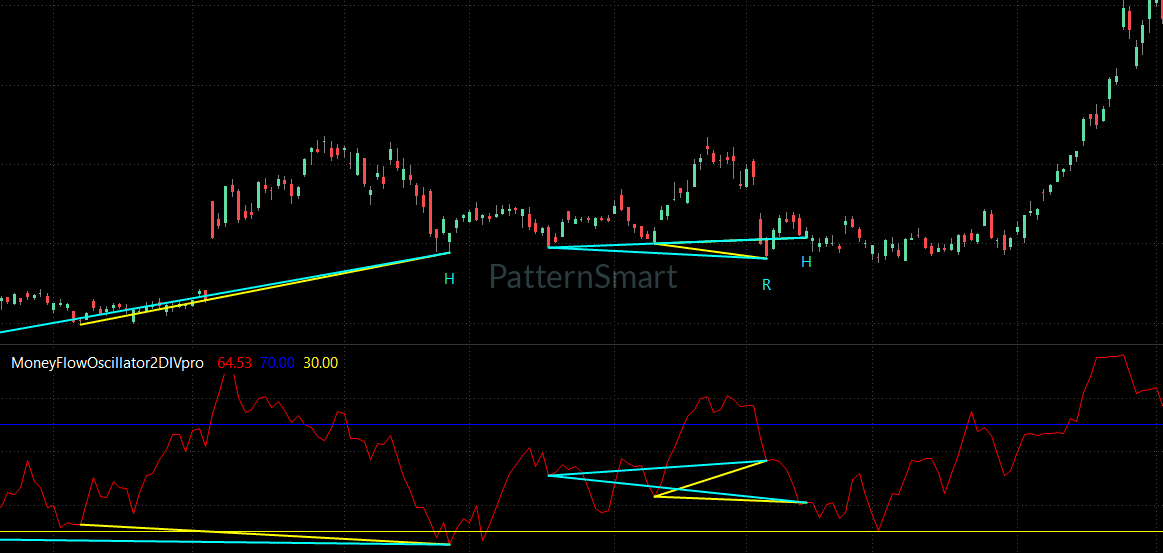
Why Market Participation Matters
Price movement is the visible result of market activity, but the degree of participation behind that movement can change over time.
Money Flow evaluates the relationship between price movement and trading activity, providing another perspective on whether buying or selling pressure is supporting the prevailing trend.
This perspective can help traders examine questions such as:
- Is buying pressure supporting continued price appreciation?
- Is selling pressure supporting a developing decline?
- Is participation weakening while price continues moving?
- Is the market showing evidence of changing conviction?
- Does price movement remain consistent with underlying participation?
These questions are particularly relevant when analyzing extended trends, major market moves, and potential changes in market behavior.
Money Flow should therefore not be viewed simply as a volume indicator. Its analytical role within PatternSmart is to provide a perspective on capital flow and market participation.
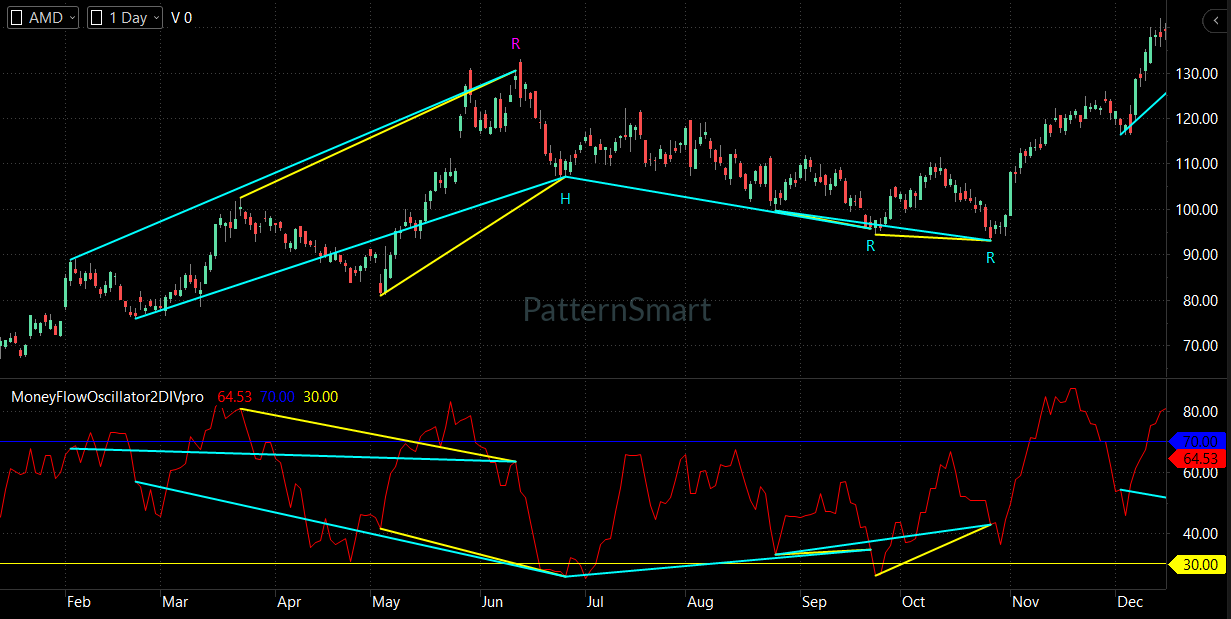
From Price Movement to Capital Flow
Consider an established upward trend.
Price continues producing higher highs, but the underlying Money Flow relationship begins to weaken. Price has not necessarily reversed, but the participation supporting the advance may no longer be developing at the same pace.
This is where divergence becomes informative.
The important observation is not:
“Price must reverse.”
Instead:
“Price and market participation are no longer communicating exactly the same information.”
That discrepancy deserves further evaluation.
The same principle applies during declining markets. If price continues making lower lows while selling pressure begins to weaken, the divergence may provide additional information about changing market conviction.
MoneyFlow Double Divergence helps organize these observations into a consistent analytical framework.
Double Divergence: A Confirmation-Based Methodology
The PatternSmart Double Divergence methodology is designed as an analytical process rather than a standalone trading signal.
Its core sequence is:
Observe → Compare → Confirm → Interpret → Evaluate
Price action remains the primary source of information. The selected indicator provides another analytical perspective.
For Money Flow, that perspective is buying and selling pressure.
A divergence observation can therefore be evaluated alongside:
- Price action
- Market structure
- Support and resistance
- Trend direction
- Volatility
- Higher timeframe conditions
- Other independent technical evidence
The purpose of confirmation is to strengthen analytical confidence, not to create certainty.
This approach is particularly important for Money Flow because participation can vary substantially between different markets.
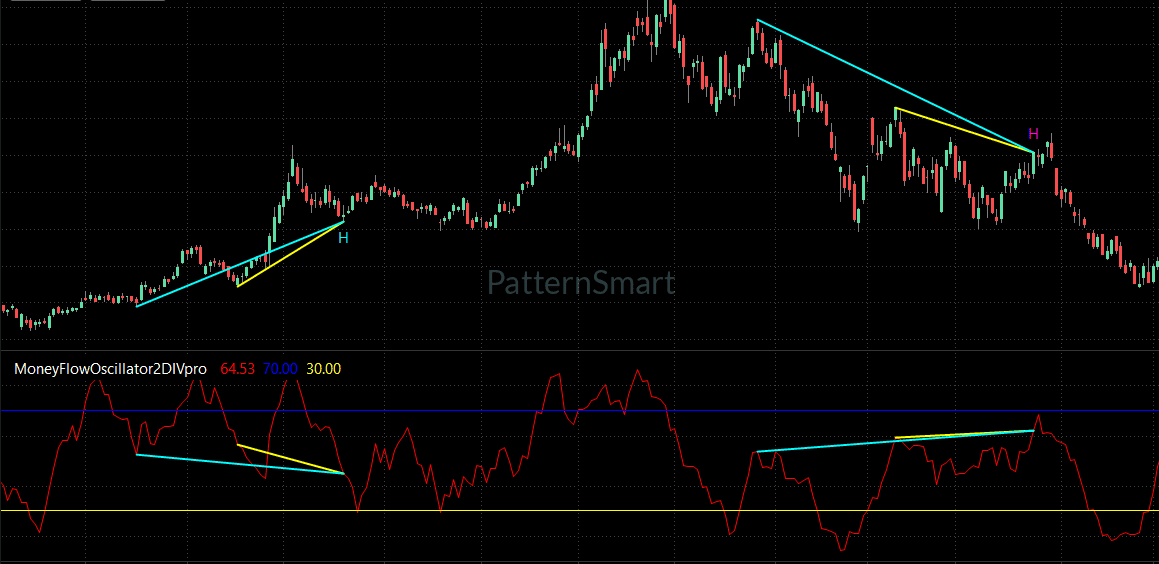
Understanding Money Flow Double Divergence
Money Flow divergence often becomes relevant when price continues moving while underlying participation weakens.
Bullish Regular Divergence
Bullish Regular Divergence examines situations where price continues developing downward weakness while Money Flow provides evidence of comparatively stronger participation.
This may indicate that selling pressure is no longer developing in complete agreement with price.
The observation can become particularly relevant when evaluating an extended decline or a developing market transition.
Bearish Regular Divergence
Bearish Regular Divergence examines the opposite relationship.
Price continues advancing while Money Flow shows comparatively weaker participation.
This may suggest that buying pressure is no longer keeping pace with the price advance.
Bullish Hidden Divergence
Bullish Hidden Divergence provides a different perspective by examining divergence within an existing bullish market structure.
It can contribute to evaluating whether a pullback remains consistent with broader bullish participation.
Bearish Hidden Divergence
Bearish Hidden Divergence provides the corresponding perspective within bearish structures.
It can help analysts evaluate whether a temporary upward movement remains consistent with broader selling pressure.
The four classifications organize observations; they do not rank signals or imply a guaranteed outcome.
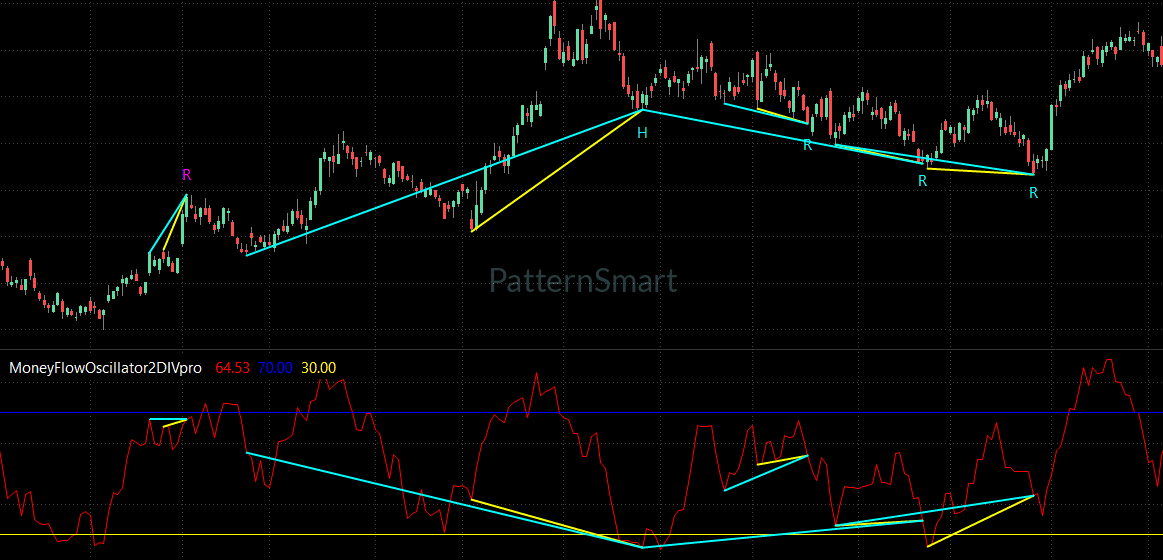
Capital Flow Analysis for Different Market Conditions
Money Flow can be particularly useful in markets where reliable volume information is available.
The Indicator Knowledge Base identifies several environments where Money Flow analysis can be relevant:
- Markets with reliable volume information
- Trending markets
- High-liquidity markets
- Markets with significant institutional participation
Its limitations are equally important. Volume quality can vary between markets, and Money Flow divergence is best interpreted alongside price action and broader market context.
This makes context an essential part of Money Flow analysis.
A divergence in a highly liquid market with clear participation characteristics may provide a different analytical perspective from an observation in a market where volume information is less reliable.
Structured Money Flow Analysis in MultiCharts
MultiCharts is designed around structured analysis, strategy development, quantitative research, and repeatable workflows.
This environment fits naturally with a participation-focused analytical process.
Instead of treating a Money Flow divergence as an isolated chart event, traders can incorporate it into a broader research workflow:
Market Structure
↓
Price Movement
↓
Money Flow
↓
Double Divergence
↓
Confirmation
↓
Technical Evaluation
This approach can be useful for traders who want to examine market participation systematically across different instruments, chart intervals, and research scenarios.
The platform changes the workflow environment; it does not change the underlying Double Divergence methodology.
Flexible Signal Configuration
MoneyFlow Double Divergence Pro provides independent controls for the four official divergence categories:
- Show Regular Bullish
- Show Regular Bearish
- Show Hidden Bullish
- Show Hidden Bearish
This allows users to focus the chart on the types of market-participation relationships relevant to their current analysis.
For example, an analyst researching potential changes in participation may concentrate on Regular Divergence, while continuation-oriented research may examine Hidden Divergence.
These controls determine which signal categories are evaluated or displayed; they do not change the underlying Double Divergence methodology.
Control Confirmation with Wait 1 Bar
Wait 1 Bar controls signal confirmation timing.
When enabled, the indicator adds one completed bar before finalizing the signal. This separates the initial divergence observation from its confirmation stage.
This distinction is important because confirmation is central to the PatternSmart methodology.
Wait 1 Bar controls when confirmation occurs.
Enhanced Mode controls whether additional structural validation is applied.
They therefore perform different roles within the analytical workflow.
Enhanced Mode for Additional Structural Validation
Enhanced Mode applies an additional structural validation layer to detected Double Divergence signals.
When enabled, eligible divergence structures undergo additional validation before confirmation. It does not create a new divergence category or replace the standard methodology.
This provides a configurable way to place greater emphasis on structural consistency when evaluating Money Flow divergence.
Refine Structural Evaluation
MoneyFlow Double Divergence Pro includes three Advanced Parameters:
Divergence Bar Range
Defines the structural search boundaries used during divergence evaluation.
Available range selections include:
- ShortRange
- MidRange
- LongRange
Divergence Lookback
Controls swing point identification during structural evaluation.
Filter Length
Controls the internal smoothing used during structural evaluation.
These parameters operate at different stages of the structural analysis process and can influence how divergence structures are evaluated. They should be understood as analytical configuration parameters rather than alternative trading methodologies.
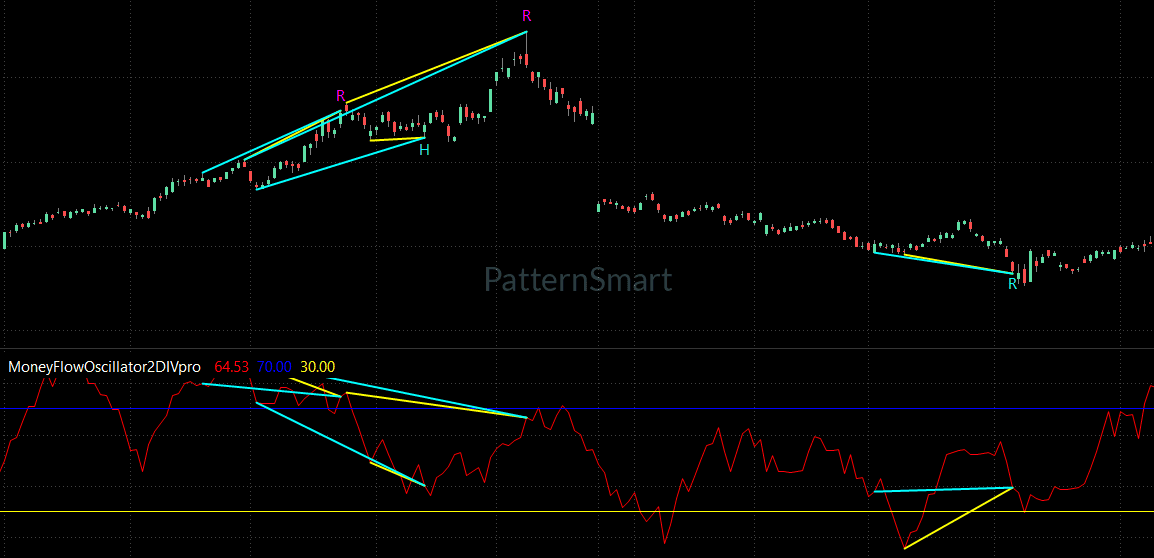
Keep Participation Analysis Visually Clear
MoneyFlow Double Divergence Pro can display both the Money Flow analysis and its divergence relationships.
Relevant visualization controls include:
- Show Char
- Show Line
- Only Show Last Signal Within Bars
- Price Line Brush
- Price Line Dash Style
- Price Line Width
Show Line can display the relationships between price and Money Flow, while Show Char provides chart labels for confirmed signals.
Only Show Last Signal Within Bars can help manage historical graphical objects and reduce chart clutter.
These settings affect presentation only. They do not change divergence detection, confirmation, filtering, or alerts.
Alerts for Confirmed Money Flow Signals
For users monitoring multiple charts or markets, Enable Alert and Alert Sound provide notification options after signal confirmation.
The distinction between alerts and analysis is important.
Alerts do not generate or filter divergence signals. They communicate information after the analytical process has produced a confirmed signal.
This allows notifications to remain separate from the underlying analytical engine.
Practical Benefits of Market Participation Analysis
MoneyFlow Double Divergence Pro can contribute to several areas of technical research.
Evaluate Buying Pressure
Examine whether buying pressure continues to support advancing prices.
Evaluate Selling Pressure
Study whether selling pressure remains consistent with declining price movement.
Identify Changing Participation
Divergence can highlight situations where market participation begins changing before the price structure fully reflects the shift.
Examine Market Conviction
Changes in participation can provide another perspective on the conviction behind a market move.
Complement Price Analysis
Money Flow adds a participation perspective to price-based technical analysis rather than attempting to replace it.
Support Structured Research
MultiCharts users can incorporate participation analysis into repeatable chart-analysis and strategy-development workflows.
These benefits are analytical rather than predictive. The objective is to organize and interpret technical evidence more effectively.
Who Is MoneyFlow Double Divergence Pro For?
MoneyFlow Double Divergence Pro is particularly relevant to:
- Traders who use volume analysis
- Swing traders
- Position traders
- Technical analysts
- Multi-asset traders
- Institutional-style analysts
- Traders studying buying and selling pressure
- Strategy developers using MultiCharts
It may be especially relevant when reliable volume information and meaningful market participation data are available.
Frequently Asked Questions
What does Money Flow measure?
Money Flow evaluates the relationship between price movement and trading activity, providing insight into buying pressure, selling pressure, and market participation.
Is Money Flow simply a volume indicator?
No. Within the PatternSmart framework, Money Flow is used primarily to evaluate capital flow, buying pressure, selling pressure, and market participation rather than volume alone.
What does Money Flow divergence tell traders?
It identifies situations where price movement and underlying participation begin behaving differently.
For example, price may continue rising while buying pressure weakens. This may provide additional evidence that deserves further technical evaluation.
Does a bearish Money Flow divergence guarantee a reversal?
No. Divergence is additional technical evidence, not a prediction or guarantee. Market structure, price action, support and resistance, and other confirmation should also be considered.
When is Money Flow most useful?
The Indicator Knowledge Base identifies markets with reliable volume information, trending markets, high-liquidity markets, and environments with significant institutional participation as particularly relevant applications.
Can MoneyFlow Double Divergence be used for continuation analysis?
Yes. Hidden Divergence can contribute to the analysis of continuation conditions, provided the observation is interpreted within the prevailing market structure.
What is Enhanced Mode?
Enhanced Mode applies additional structural validation to detected Double Divergence signals before they are confirmed.
Do visualization settings change the signals?
No. Display settings affect chart presentation only and do not change the underlying analytical results.
Why use Money Flow instead of another Double Divergence indicator?
Each Double Divergence indicator provides a different analytical perspective. Money Flow is specifically focused on buying and selling pressure and market participation, making it appropriate when capital flow is an important part of the analytical objective.
Bring Market Participation Analysis to MultiCharts
A price chart shows the movement of the market, but understanding the participation behind that movement can add another dimension to technical analysis.
When price and market participation remain aligned, the technical picture may appear relatively consistent. When they begin to diverge, the relationship deserves closer examination.
MoneyFlow Double Divergence Pro for MultiCharts provides a structured framework for studying that relationship through buying pressure, selling pressure, capital flow, and market participation.
Combined with the PatternSmart Double Divergence methodology, it gives MultiCharts users another way to organize technical evidence within a disciplined and repeatable analytical workflow.
Explore MoneyFlow Double Divergence Pro for MultiCharts and evaluate how market participation analysis can complement your existing technical research process.
Educational Disclaimer
MoneyFlow Double Divergence Pro is a technical analysis and decision-support tool. Divergence observations are probabilistic and require interpretation within broader market context. Volume and participation data may vary between markets, and no indicator guarantees a particular market movement or trading result.
[Get Started With MoneyFlow Double Divergence Pro for MultiCharts]
Looking for the complete mathematical breakdown, step-by-step optimization guides, and advanced trading strategies? Explore our comprehensive documentation:
Visit the Technical Inputs Manual: Double Divergence Pro for full parameter tuning.