Analyze Momentum Shifts and Reversal Timing with Structured RSI Divergence
Price can continue moving in the same direction even when the momentum behind that movement begins to change.
A market may reach a new high while bullish momentum is weakening, or establish a new low while selling momentum begins to lose strength. These differences between price and momentum can provide valuable information when evaluating potential turning points.
RSI Double Divergence Pro for MultiCharts combines the Relative Strength Index (RSI) with the PatternSmart Double Divergence methodology to provide a structured framework for analyzing momentum shifts, momentum exhaustion, buying and selling pressure, and potential reversal conditions.
The objective is not to predict every market reversal. Instead, the indicator helps organize divergence information so it can be evaluated alongside price action, market structure, and additional confirmation.
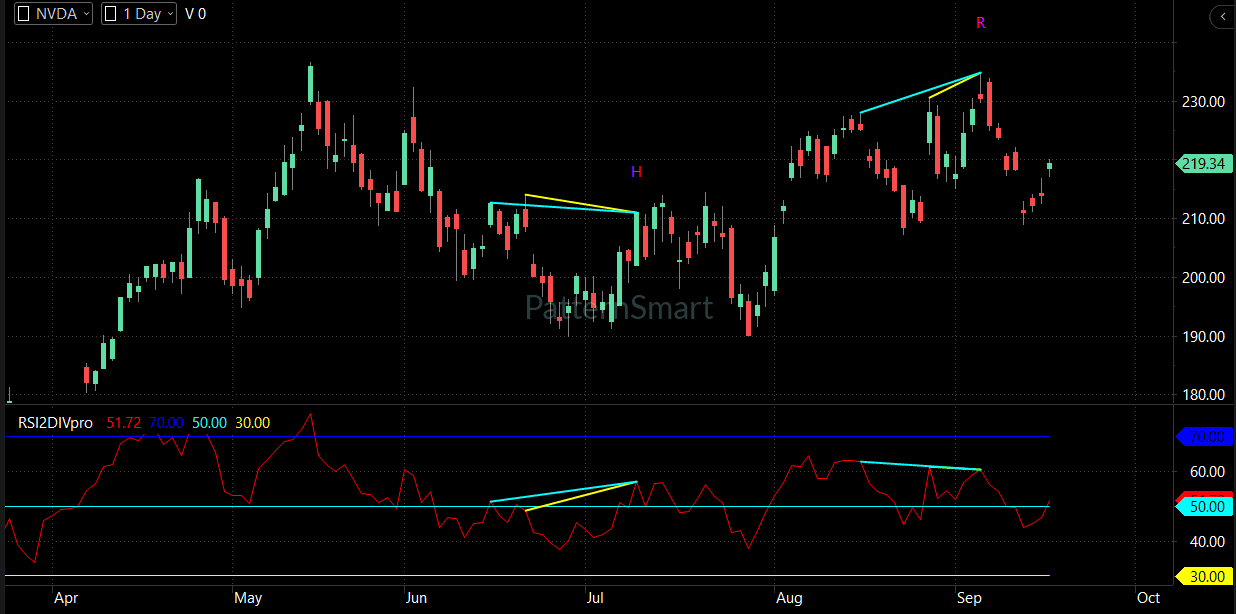
Why RSI Is Useful for Momentum Analysis
RSI evaluates the speed and magnitude of recent price movement, making it a widely used tool for studying market momentum.
This makes RSI useful for questions that price direction alone cannot fully answer:
- Is bullish momentum strengthening or weakening?
- Is selling pressure losing momentum?
- Is a price advance becoming less supported by momentum?
- Is a decline showing signs of momentum exhaustion?
- Could a temporary pullback be developing within a larger trend?
RSI is often associated with overbought and oversold readings, but those conditions are only one part of its analytical value.
For Double Divergence analysis, the more important question is often how RSI behavior compares with price behavior.
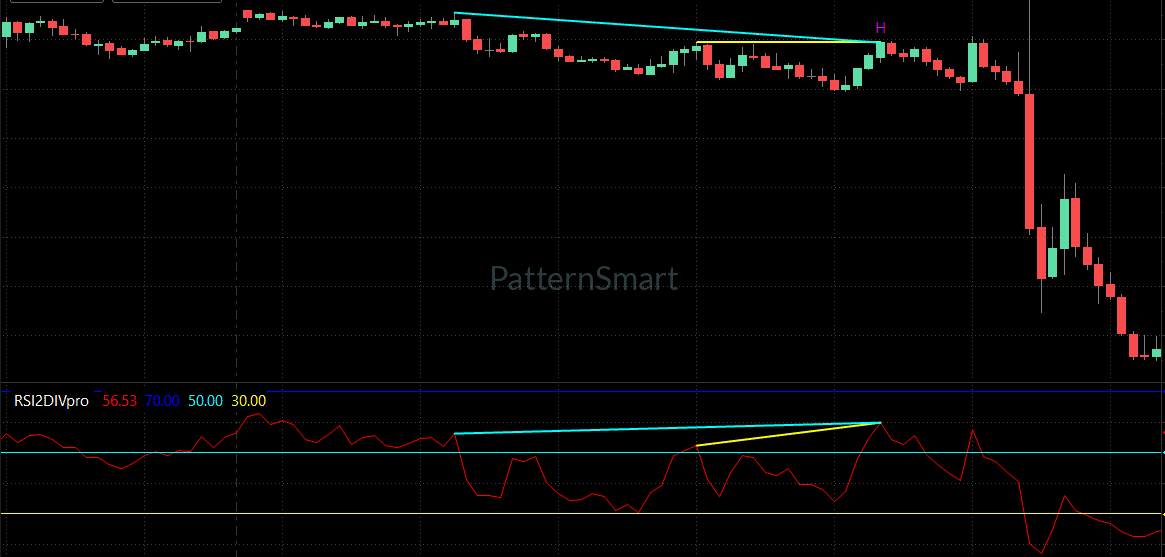
When Price and Momentum Tell Different Stories
Imagine a market that continues producing higher highs.
At first, RSI may also confirm the strength of the upward movement. But as the advance develops, RSI may fail to establish a corresponding new high.
Price is still rising.
Momentum, however, is no longer behaving in the same way.
This difference can become a meaningful analytical observation.
The same principle applies to declining markets. Price may continue producing lower lows while RSI begins showing comparatively stronger momentum.
These situations do not guarantee that a reversal will follow. They indicate that the relationship between price and momentum has changed.
That change is what makes RSI particularly useful for reversal timing and momentum analysis.
The PatternSmart Double Divergence Methodology
RSI Double Divergence follows the same methodology used throughout the PatternSmart Double Divergence product family:
Observe → Compare → Confirm → Interpret → Evaluate
Price remains the primary source of information.
RSI provides an additional momentum perspective.
Double Divergence compares these two sources of information to identify situations where price movement and momentum are no longer behaving in complete agreement.
The next step is confirmation.
Price action, market structure, support and resistance, trend direction, volatility, and higher-timeframe conditions can all contribute to determining how significant a divergence observation may be.
This confirmation-based approach helps prevent divergence from being treated as an automatic trading instruction.
Regular and Hidden Divergence
RSI Double Divergence Pro supports the four standard PatternSmart divergence classifications.
Bullish Regular Divergence
Bullish Regular Divergence examines a relationship in which price develops lower lows while RSI provides comparatively stronger momentum.
This may indicate weakening downside momentum and can become relevant when evaluating potential reversal conditions after an extended decline.
Bearish Regular Divergence
Bearish Regular Divergence occurs when price continues developing higher highs while RSI shows comparatively weaker momentum.
This can provide evidence that upward momentum is becoming exhausted, even though price has not yet reversed.
Bullish Hidden Divergence
Bullish Hidden Divergence provides a continuation-oriented perspective.
When a broader bullish structure remains intact, divergence during a temporary pullback can provide additional information when evaluating whether the underlying momentum relationship remains supportive of continuation.
Bearish Hidden Divergence
Bearish Hidden Divergence provides the corresponding perspective within a bearish structure.
It can help analysts evaluate whether a temporary upward retracement is occurring while the broader bearish momentum relationship remains intact.
The signal classification organizes the observation. Its interpretation still depends on market context and confirmation.
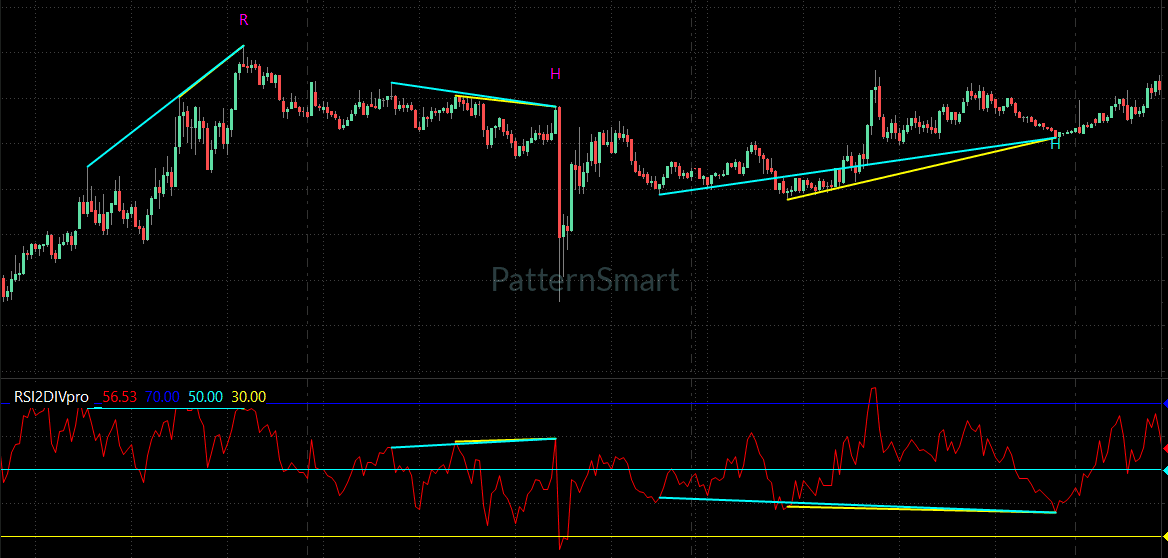
RSI Double Divergence for Reversal Analysis
One of RSI’s key analytical applications is identifying potential turning points following extended price movement.
However, reversal analysis requires discipline.
A divergence may appear because momentum is temporarily slowing while the existing trend remains healthy. Strong trends can therefore produce multiple divergence observations without immediately reversing.
This is one reason the PatternSmart methodology emphasizes confirmation.
A practical analytical sequence is:
Extended price movement
↓
Momentum begins to weaken
↓
RSI divergence develops
↓
Signal is confirmed
↓
Price action and market structure are evaluated
↓
Reversal potential is assessed
The divergence identifies a condition worth examining. It does not determine the outcome.
Configuration for Structured Divergence Analysis
RSI Double Divergence Pro includes configurable features that allow traders to adapt the analytical workflow without changing the underlying methodology.
Wait 1 Bar
Wait 1 Bar controls whether one completed confirmation bar is required before a detected Double Divergence signal is finalized.
When enabled, confirmation occurs after the next bar closes. When disabled, the signal can be confirmed once the internal divergence conditions have been satisfied.
The setting therefore affects confirmation timing, not the fundamental divergence methodology.
Regular and Hidden Signal Controls
The indicator provides independent controls for:
- Show Regular Bullish
- Show Regular Bearish
- Show Hidden Bullish
- Show Hidden Bearish
This allows the analytical workspace to concentrate on the divergence categories relevant to the current research objective.
Refine Structural Evaluation
For users who want greater control over how historical structures are evaluated, RSI Double Divergence Pro includes three Advanced Parameters.
Divergence Bar Range
Divergence Bar Range defines the structural search boundaries.
The documented choices are:
- ShortRange
- MidRange
- LongRange
These options influence the distance and scope of historical structures considered during divergence evaluation.
Divergence Lookback
Divergence Lookback controls the historical bars evaluated when identifying local swing highs and swing lows.
Increasing the lookback generally requires larger structural movements before a swing point is recognized, while reducing it allows smaller movements to qualify.
Filter Length
Filter Length controls the internal smoothing used during structural evaluation.
Higher values produce smoother structural evaluation, while lower values produce more responsive evaluation.
These parameters affect the analytical engine rather than the visual presentation of the indicator.
Additional Validation with Enhanced Mode
Enhanced Mode applies additional structural validation before a potential divergence signal is confirmed.
It does not create a separate divergence methodology. Instead, it adds another validation stage to the existing Double Divergence process.
This can be useful when the objective is to place greater emphasis on structural consistency before a signal becomes confirmed.
Together, the structural parameters and Enhanced Mode create a configurable evaluation process:
Structural Search → Swing Identification → Smoothing → Additional Validation → Confirmation
The settings should be treated as analytical configuration options rather than universal recommendations.
Clear Visualization of Price and RSI Divergence
RSI Double Divergence Pro provides visualization controls that help users examine divergence relationships directly on the chart.
Relevant options include:
- Show Char
- Show Line
- Only Show Last Signal Within Bars
- Price Line Brush
- Price Line Dash Style
- Price Line Width
Show Line controls the display of divergence lines, while Show Char controls signal labels.
Only Show Last Signal Within Bars can help reduce historical chart clutter by limiting nearby displayed signals.
These features control presentation only. They do not change the underlying divergence calculations or confirmation logic.
Alerts for a Structured MultiCharts Workflow
RSI Double Divergence Pro also provides Enable Alert and Alert Sound.
These features communicate newly confirmed signals without changing the signal calculation itself.
For traders and analysts monitoring multiple instruments, alerts can reduce the need for continuous visual monitoring while keeping the analytical process separate from notification behavior.
RSI Double Divergence Pro in MultiCharts
MultiCharts is oriented toward systematic analysis, strategy development, backtesting, optimization, portfolio evaluation, and rule-based workflows.
That environment provides a useful setting for applying RSI Double Divergence as part of a repeatable research process.
Instead of evaluating divergence as an isolated chart event, users can incorporate it into a broader workflow:
Market Selection
→ Price Structure
→ RSI Momentum Analysis
→ Double Divergence
→ Confirmation
→ Strategy Research or Technical Evaluation
For systematic traders, the value of this approach lies in consistency. The same analytical framework can be examined across different instruments, timeframes, and historical market conditions.
The platform provides the environment for structured analysis; the Double Divergence methodology remains consistent across supported platforms.
Practical Applications
RSI Double Divergence Pro can support several areas of technical analysis.
Momentum Shift Analysis
Examine situations where price continues moving while RSI momentum begins changing.
Momentum Exhaustion
Identify divergence conditions that may indicate declining momentum following an extended price movement.
Reversal Timing
Use Regular Divergence as additional evidence when evaluating potential turning points.
Continuation Analysis
Use Hidden Divergence to examine whether momentum relationships remain consistent with an existing trend after a pullback.
Buying and Selling Pressure
RSI behavior can provide another perspective on changing buying and selling pressure as price develops.
Multi-Timeframe Research
Compare momentum and divergence observations across different chart structures as part of a broader analytical process.
These applications provide analytical information rather than guaranteed trading outcomes.
Market Conditions and Limitations
The RSI Double Divergence knowledge base identifies several environments where the indicator can be particularly relevant:
- Range-bound markets
- Swing markets
- Moderate trends
- Momentum-driven reversals
RSI can also produce numerous divergence observations during strong trends. Consequently, divergence should not be interpreted without market context and confirmation from price action.
This limitation is not a reason to disregard divergence. It is a reminder that momentum information becomes more useful when interpreted within the broader structure of the market.
Who Is RSI Double Divergence Pro For?
RSI Double Divergence Pro is designed for traders and analysts interested in:
- Momentum analysis
- Reversal analysis
- Swing trading
- Short-term trading
- Multi-timeframe analysis
- Systematic technical research
- Multi-market analysis
- Strategy development in MultiCharts
It is particularly relevant to users who want to study momentum changes without relying solely on traditional RSI overbought and oversold interpretations.
Frequently Asked Questions
What does RSI measure?
RSI evaluates the speed and magnitude of recent price movement, making it useful for studying momentum changes and potential exhaustion.
Is RSI Double Divergence just an overbought and oversold indicator?
No. While RSI is commonly associated with overbought and oversold conditions, the PatternSmart approach emphasizes momentum shifts, exhaustion, buying and selling pressure, and reversal timing.
What does RSI divergence tell traders?
RSI divergence identifies a situation where price behavior and RSI momentum are no longer moving in complete agreement. This can provide additional information when evaluating changing market conditions.
Does RSI divergence guarantee a reversal?
No. Regular divergence may indicate weakening momentum, but the existing trend can continue. Confirmation from price action, market structure, and other technical evidence remains important.
What is the difference between Regular and Hidden Divergence?
Regular Divergence is commonly used when evaluating potential reversal conditions, while Hidden Divergence can support analysis of trend continuation following temporary pullbacks.
Can RSI Double Divergence be used in strong trends?
Yes, but the Indicator Knowledge Base notes that strong trends can produce numerous divergence signals. Context and confirmation are therefore particularly important.
What does Enhanced Mode do?
Enhanced Mode applies additional structural validation before a divergence signal is confirmed. It is a filtering feature rather than a separate divergence methodology.
Can I control which divergence types appear?
Yes. Regular Bullish, Regular Bearish, Hidden Bullish, and Hidden Bearish signals can be independently controlled.
Why is RSI Double Divergence suitable for MultiCharts?
MultiCharts is designed for systematic analysis, strategy development, backtesting, and structured workflows. RSI Double Divergence can therefore be incorporated into repeatable technical research and strategy-development processes.
Turn RSI Momentum Analysis into a Structured Workflow
Momentum can change before the price structure changes.
That is what makes RSI divergence particularly useful for technical analysts studying potential turning points. When price continues in one direction while RSI momentum begins behaving differently, the divergence provides an observation that can be investigated rather than ignored.
RSI Double Divergence Pro for MultiCharts combines this momentum perspective with the PatternSmart confirmation-based Double Divergence methodology.
For MultiCharts users, the result is a structured framework for examining momentum shifts, exhaustion, reversal timing, and continuation conditions within a systematic analytical workflow.
Explore RSI Double Divergence Pro for MultiCharts and incorporate structured RSI momentum analysis into your technical research process.
Educational Disclaimer
RSI Double Divergence Pro is a technical analysis and decision-support tool. Divergence represents analytical information rather than a guaranteed market prediction. RSI signals should be evaluated together with price action, market structure, confirmation, and broader market conditions. No indicator guarantees a particular trading outcome or result.
[Get Started With RSI Double Divergence Pro for MultiCharts]
Looking for the complete mathematical breakdown, step-by-step optimization guides, and advanced trading strategies? Explore our comprehensive documentation:
Visit the Technical Inputs Manual: Double Divergence Pro for full parameter tuning.
Read the master guide on the Double Divergence Indicator Series.