Identify Early Changes in Price Momentum with Structured Divergence Analysis
Price can continue moving in the same direction even after its rate of change begins to slow.
That distinction matters. A market may still be producing higher highs while bullish acceleration is weakening, or continue making lower lows while bearish acceleration begins to diminish. These changes in momentum can provide important information before a visible trend transition develops.
Momentum Double Divergence Pro for MultiCharts combines the Momentum indicator with the PatternSmart Double Divergence methodology to help traders evaluate these changes in price acceleration and deceleration.
Instead of treating divergence as an automatic reversal signal, the indicator provides additional technical evidence that can be evaluated within broader market structure, price action, and confirmation.
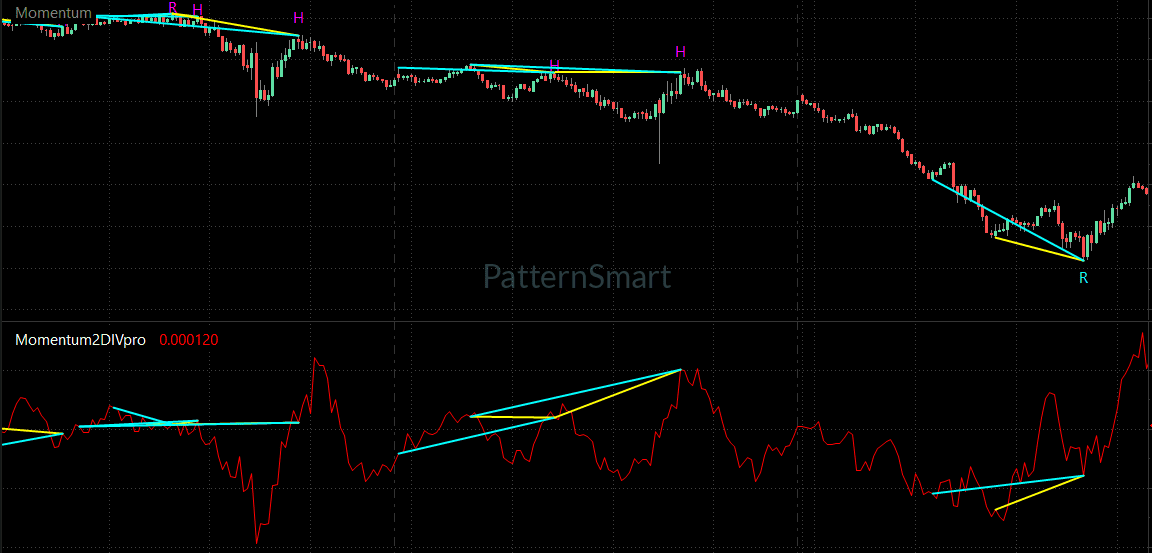
Why Momentum Matters
The Momentum indicator measures the rate of price change relative to a previous period.
This makes Momentum different from indicators that primarily evaluate trend direction, statistical deviation, or directional dominance. Its focus is the speed at which price is moving.
Momentum analysis can therefore reveal:
- Price acceleration
- Price deceleration
- Momentum expansion
- Momentum contraction
- Momentum deterioration
- Early trend exhaustion
- Developing changes in market behavior
A rising market does not necessarily mean bullish momentum is strengthening. Likewise, a declining market does not automatically mean bearish momentum is increasing.
Understanding this difference is one of the most useful applications of Momentum analysis.
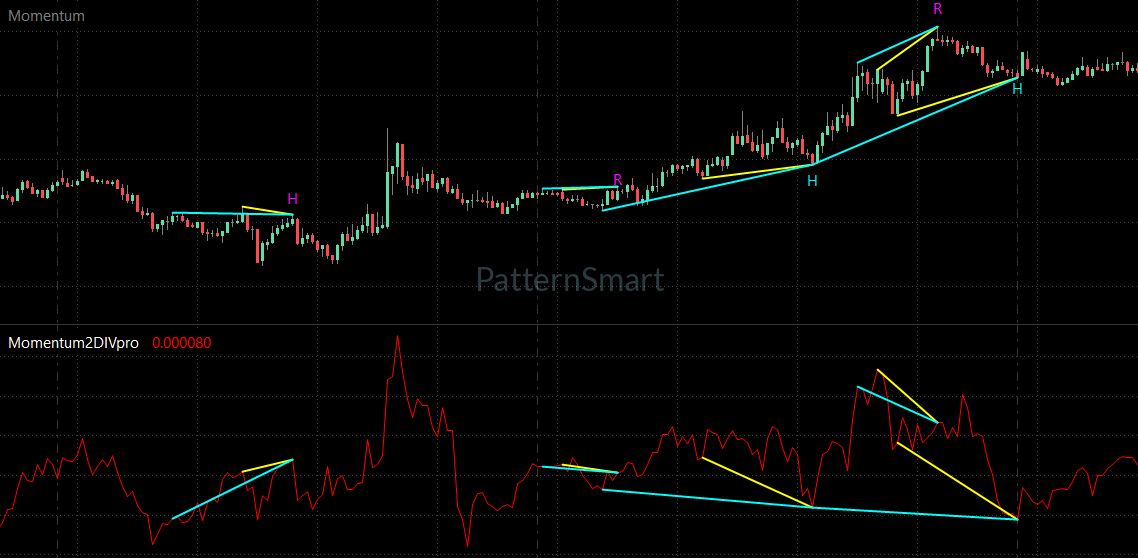
From Momentum Observation to Double Divergence
Traditional divergence compares price behavior with indicator behavior.
PatternSmart Double Divergence adds a structured confirmation framework to this process.
The objective is not to predict the next market move. Instead, the methodology helps traders evaluate whether the relationship between price and Momentum is becoming increasingly inconsistent.
For example:
Price continues higher → Momentum begins weakening → Divergence develops → Confirmation is evaluated
Or:
Price continues lower → Downward momentum begins weakening → Divergence develops → Confirmation is evaluated
This distinction is important because temporary momentum deterioration does not necessarily mean that a trend has ended. Price can continue trending while momentum contracts.
Double Divergence is therefore designed to provide additional analytical evidence, not certainty.
Momentum Double Divergence and Early Market Transitions
Momentum is particularly useful when studying early market transitions because it reacts directly to changes in price acceleration.
A developing trend may initially move rapidly, then gradually lose momentum. Price may still be advancing, but the underlying rate of change can begin to deteriorate.
This creates an important analytical question:
Is the trend still developing with healthy momentum, or is momentum deterioration becoming significant?
Momentum Double Divergence provides a structured way to examine this relationship.
The indicator is particularly suited to:
- Developing trends
- Momentum-driven markets
- Swing markets
- Early trend transitions
- Breakout environments
- Fast-moving markets
Its responsiveness also means that additional confirmation is important, particularly during volatile conditions where short-term momentum changes can occur frequently.
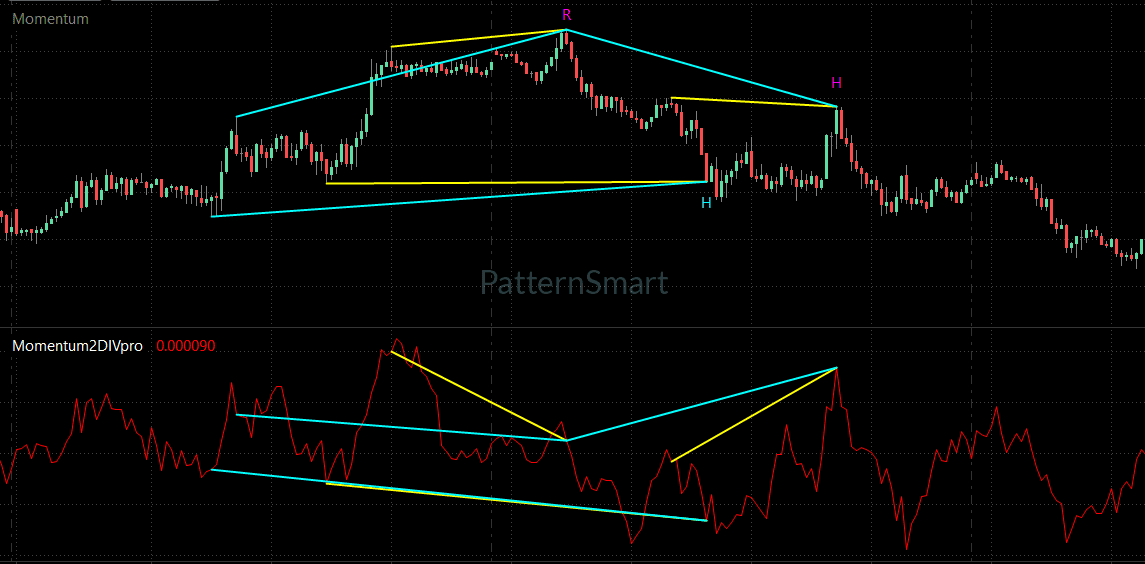
Regular and Hidden Double Divergence
Momentum Double Divergence Pro supports four official signal categories:
Bullish Regular Divergence
This may identify a situation where price continues making lower lows while bearish momentum begins weakening.
It can provide evidence that downward acceleration is deteriorating and that changing market conditions deserve further evaluation.
Bearish Regular Divergence
This occurs when price continues making higher highs while bullish momentum begins weakening.
The observation may indicate that upward acceleration is deteriorating even though price has not yet changed direction.
Bullish Hidden Divergence
Hidden bullish divergence can contribute to continuation analysis when a market is undergoing a temporary pullback within a broader bullish structure.
Bearish Hidden Divergence
Hidden bearish divergence provides the corresponding perspective when evaluating continuation within a bearish market structure.
The significance of each divergence type depends on the surrounding market context. Neither Regular nor Hidden Divergence should be interpreted independently of price structure.
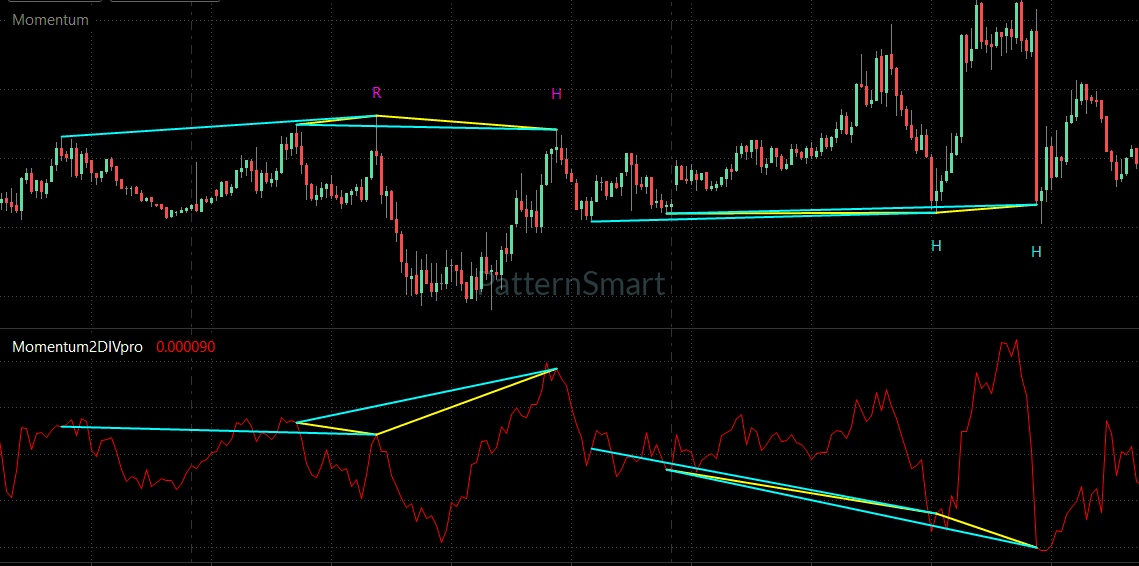
Designed for Confirmation, Not Prediction
The PatternSmart methodology places confirmation before conclusions.
Momentum Double Divergence should therefore be considered as one component of a broader analytical process:
- Identify the prevailing market structure.
- Observe price acceleration or deceleration.
- Examine Momentum behavior.
- Evaluate the Double Divergence relationship.
- Consider confirmation.
- Compare the signal with price action and nearby support or resistance.
- Evaluate the broader market context.
This approach helps distinguish a meaningful momentum shift from a temporary slowdown.
A Momentum Double Divergence signal may contribute to a stronger analytical interpretation, but it does not guarantee that a reversal or continuation will occur.
Flexible Momentum and Divergence Configuration
Momentum Double Divergence Pro provides configuration options designed to adapt the indicator to different analytical workflows.
Momentum Period
The Period parameter controls the Momentum calculation period.
This allows the underlying Momentum analysis to be configured according to the user’s analytical requirements.
Divergence Bar Range
Divergence Bar Range provides three structural search choices:
- ShortRange
- MidRange
- LongRange
These options determine the scope of historical divergence structures being evaluated.
Divergence Lookback
Divergence Lookback controls the number of historical bars considered when identifying local swing highs and swing lows.
Filter Length
Filter Length controls the internal smoothing period used during structural evaluation.
These parameters influence structural evaluation and sensitivity; they do not create alternative divergence methodologies.
Refine Signal Confirmation with Enhanced Mode
Enhanced Mode provides an additional structural filtering stage.
Rather than generating a different type of divergence, it applies additional validation to an already detected divergence structure before confirmation.
This is particularly relevant when traders want to evaluate divergence through a more selective structural process.
It is important to distinguish this from Wait 1 Bar:
- Enhanced Mode applies additional structural validation.
- Wait 1 Bar affects confirmation timing.
These features serve different purposes within the indicator workflow.
Choose the Signals You Want to Analyze
Momentum Double Divergence Pro provides independent controls for:
- Show Regular Bullish
- Show Regular Bearish
- Show Hidden Bullish
- Show Hidden Bearish
This allows users to focus the chart on the divergence categories relevant to their current analytical objective.
For example, an analyst studying potential momentum deterioration may emphasize Regular Divergence, while continuation analysis may make greater use of Hidden Divergence.
Clear Divergence Visualization
Momentum Double Divergence Pro displays Momentum in its indicator subchart while divergence relationships can be represented visually on both the Momentum subchart and the main price chart.
The MultiCharts implementation supports:
- Show Char
- Show Line
- Only Show Last Signal Within Bars
- Price line colors
- Price line style
- Price line width
These settings control presentation rather than the underlying divergence calculations.
The result is a charting workflow where the analytical relationship between price and Momentum can remain visible without requiring every historical signal to remain on the chart.
Alerts for Confirmed Signals
Enable Alert provides notification functionality for confirmed Double Divergence signals.
The alert system is separate from signal generation and structural filtering. Alerts communicate information after the analytical process has produced a confirmed signal.
This distinction helps keep notification functionality separate from the actual divergence methodology.
Momentum Double Divergence Pro in MultiCharts
MultiCharts is oriented toward systematic trading, strategy development, backtesting, optimization, and portfolio analysis.
This makes it a natural environment for traders who want to incorporate structured technical information into a repeatable analytical workflow.
Momentum Double Divergence can complement this process by providing an additional perspective on price acceleration and deceleration.
A structured workflow might involve:
Market Data → Momentum Analysis → Divergence Evaluation → Confirmation → Strategy Research
For systematic traders, the value lies not in treating every divergence as a trading instruction, but in incorporating Momentum information into a consistent research and evaluation process.
The MultiCharts environment can therefore support both discretionary technical interpretation and systematic strategy-development workflows.
Key Analytical Benefits
Momentum Double Divergence Pro is designed to support:
Early Momentum Analysis
Monitor changes in price acceleration before they become obvious through price structure alone.
Momentum Shift Identification
Evaluate situations where price continues trending while Momentum begins moving differently.
Reversal Preparation
Regular Double Divergence can provide evidence of deteriorating acceleration that deserves further examination.
Trend Continuation Analysis
Hidden Double Divergence can provide another perspective when evaluating pullbacks within existing market structures.
Structured Technical Research
MultiCharts users can incorporate Momentum divergence into systematic and repeatable analytical workflows.
These are analytical benefits rather than guarantees of trading performance.
Who Is Momentum Double Divergence Pro For?
Momentum Double Divergence Pro is particularly relevant to:
- Momentum traders
- Swing traders
- Active technical analysts
- Day traders
- Scalpers
- Breakout traders
- Traders studying early trend transitions
- Systematic traders using MultiCharts
The Momentum version can be applied across futures, Forex, stocks, cryptocurrencies, commodities, and market indices, particularly where changes in price acceleration are an important part of market behavior.
Frequently Asked Questions
What is Momentum Double Divergence?
Momentum Double Divergence combines the Momentum indicator with the PatternSmart Double Divergence methodology to evaluate differences between price behavior and the rate of price change.
What does the Momentum indicator measure?
Momentum measures the rate of price change relative to a previous period. It focuses on acceleration and deceleration rather than directly measuring overall trend quality.
Does Momentum Double Divergence predict reversals?
No. A divergence provides analytical evidence that price and Momentum are behaving differently. Additional confirmation and market context remain important.
What is the difference between Regular and Hidden Divergence?
Regular Divergence is commonly used when evaluating potential trend transitions, while Hidden Divergence can contribute to trend continuation analysis. Both require contextual interpretation.
Why can Momentum produce early signals?
Because Momentum responds directly to the rate of price change, it can react to acceleration and deceleration before a visible change in price direction develops.
Can Momentum Double Divergence be used in volatile markets?
Yes, but volatility can increase Momentum sensitivity and produce more frequent signals. The Indicator Knowledge Base specifically notes the importance of broader market confirmation under these conditions.
Does Enhanced Mode create new divergence types?
No. Enhanced Mode provides additional structural validation for an already identified divergence structure.
Can I control which divergence types are displayed?
Yes. Regular Bullish, Regular Bearish, Hidden Bullish, and Hidden Bearish signals can be independently controlled.
Is Momentum Double Divergence a complete trading system?
No. It is a technical analysis and decision-support tool. The PatternSmart methodology is designed to provide additional evidence rather than replace trader judgment or broader market analysis.
Explore Momentum Analysis in MultiCharts
Momentum can change before price direction changes.
That makes the relationship between price movement and price acceleration an important area of technical analysis. A market may still be moving higher while bullish acceleration deteriorates, or continue falling while bearish acceleration begins to weaken.
Momentum Double Divergence Pro for MultiCharts provides a structured framework for examining these changes through Momentum-based Double Divergence analysis.
For traders and strategy developers working within MultiCharts, it can become another component of a disciplined workflow for studying momentum shifts, developing trends, and early market transitions.
Explore Momentum Double Divergence Pro for MultiCharts and integrate structured momentum analysis into your existing technical research process.
Educational Disclaimer
Momentum Double Divergence Pro is a technical analysis tool designed to provide analytical information. Divergence signals represent observations that require interpretation and confirmation. Financial markets remain uncertain, and no indicator can guarantee a particular trading outcome or result.
[Get Started With CCI Double Divergence Pro for MultiCharts]
Looking for the complete mathematical breakdown, step-by-step optimization guides, and advanced trading strategies? Explore our comprehensive documentation:
Visit the Technical Inputs Manual: Double Divergence Pro for full parameter tuning.