Skip to content

PatternSmart.com

  • Store
  • Technical analysis
    • Indicator Concepts
    • Market Analysis
    • Coding Logic
    • Case Studies
    • Bearish and Bullish
    • Bearish Patterns
    • Bullish Patterns
    • Support and Resistance
    • Dynamic Supply Demand Zone
    • Divergence Analysis
  • Services
    • Customization
    • Conversion
    • White-Label
    • Co-op
  • Platform
    • cTrader
    • Metastock
    • MT4
    • MT5
    • Multicharts
    • MultiCharts .NET
    • Ninjatrader
    • ProRealTime
    • Sierra Chart
    • Thinkorswim
    • Tradingview
  • Symbol
    • Crypto
    • Forex
    • Futures
    • Stocks
  • Contact Us
  • About Us
Top Tags
  • Double Divergence
  • Multi Time Frame (MTF)
  • NinjaTrader
  • CCI Divergence
  • RSI Divergence
  • nt8
  • CCI Double Divergence

Latest Post

Advanced Moving Average Indicator for MultiCharts .NET Advanced Moving Average indicator for NinjaTrader 8 DMI Double Divergence Pro for ProRealTime How to Create a Custom Indicator in TradingView: A Step-by-Step Guide Chart Pattern Wedge for TradingView: Automated Rising & Falling Wedge Scanner Chart Pattern Triangle Indicator for TradingView Chart Pattern Rectangle for TradingView Chart Pattern Pennant for TradingView Chart Pattern Channel for TradingView
cTrader Divergence Divergence Analysis Forex Indicator Indicator Concepts Market Analysis Support and Resistance Technical analysis TPR

USDJPY Momentum Double Divergence & TPR Confluence Analysis on cTrader: Macro Bearish Resumption Across Multi-Range Frameworks

Indicator Concepts Technical analysis TPR

Why the TPR Indicator Refuses a Multi-Timeframe (MTF) : Real-Time Precision vs. Structural Lag

Chart Pattern Chart Patterns Indicator Technical analysis Tradingview

Chart Pattern Wedge for TradingView: Automated Rising & Falling Wedge Scanner

Chart Pattern Chart Patterns Indicator Technical analysis Tradingview

Chart Pattern Triangle Indicator for TradingView

Chart Pattern Chart Patterns Indicator Indicator Concepts Tradingview

Chart Pattern Rectangle for TradingView

Chart Pattern Chart Patterns Indicator Indicator Concepts Platform Technical analysis Tradingview

Chart Pattern Pennant for TradingView

Chart Pattern Chart Patterns Indicator Indicator Concepts Platform Tradingview

Chart Pattern Channel for TradingView

  • Latest
  • Popular
  • Trending
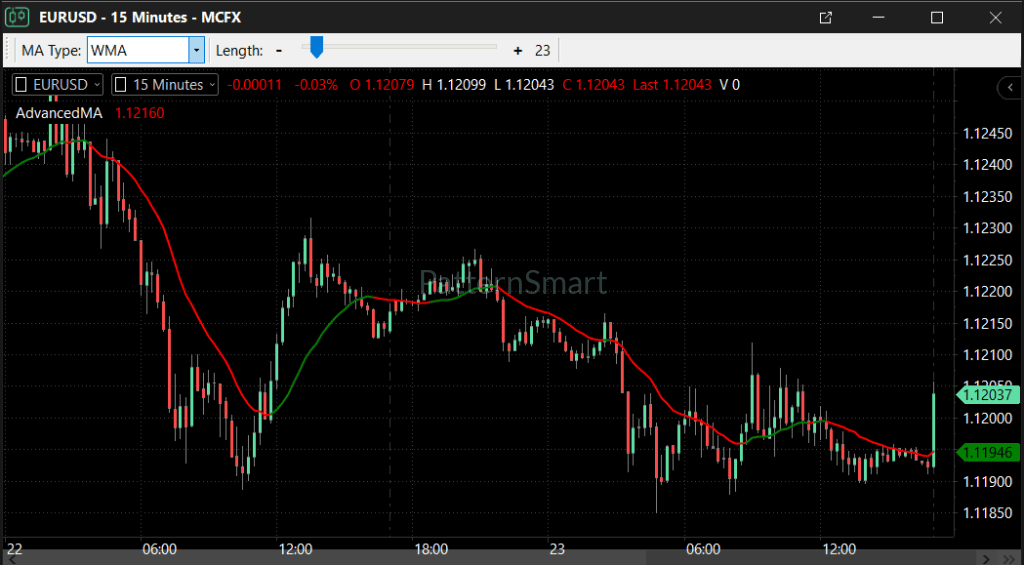
Advanced Moving Average Indicator for MultiCharts .NET
Indicator MultiCharts .NET
Advanced Moving Average Indicator for MultiCharts .NET
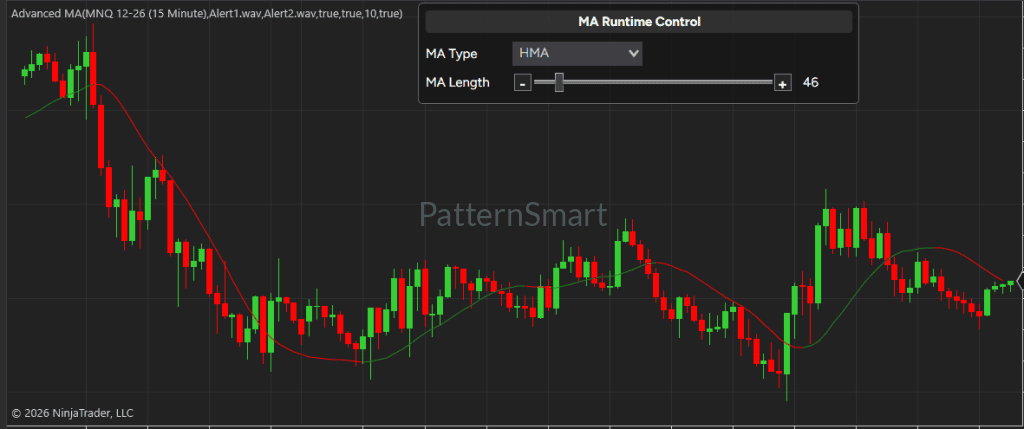
Advanced Moving Average indicator for NinjaTrader 8
Indicator Ninjatrader Platform
Advanced Moving Average indicator for NinjaTrader 8
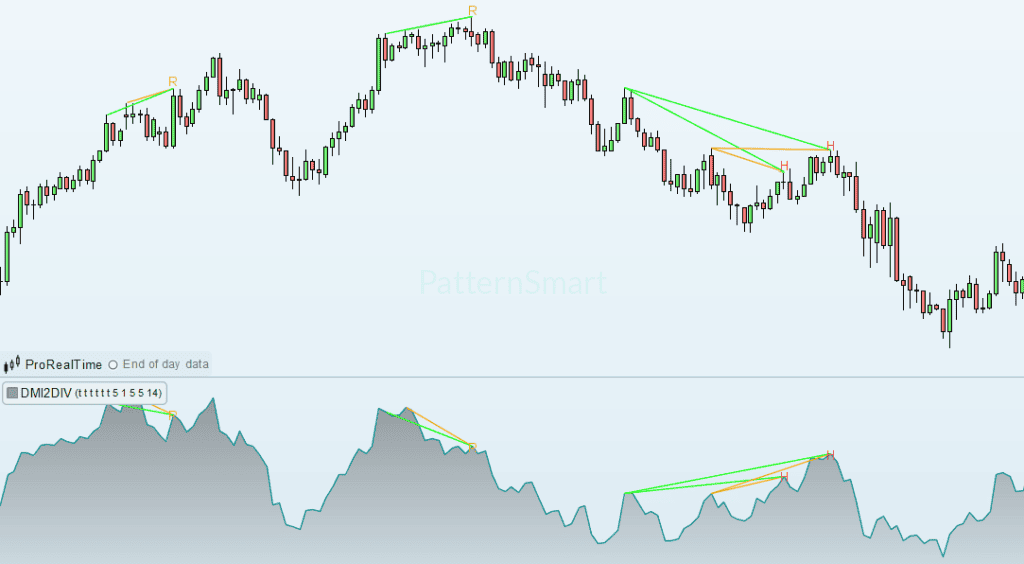
DMI Double Divergence Pro for ProRealTime
Divergence Indicator Platform ProRealTime
DMI Double Divergence Pro for ProRealTime
Indicator Ninjatrader
Super Scalper indicator custom NinjaTrader NT8 indicator
Indicator
Super Trend indicator advanced edition custom thinkorswim TOS indicator
Indicator Thinkorswim
3 Level ZigZag Session High Low Indicator custom thinkorswim TOS indicator
Advanced Moving Average Indicator for MultiCharts .NET
Indicator MultiCharts .NET
Advanced Moving Average Indicator for MultiCharts .NET
Advanced Moving Average indicator for NinjaTrader 8
Indicator Ninjatrader Platform
Advanced Moving Average indicator for NinjaTrader 8
DMI Double Divergence Pro for ProRealTime
Divergence Indicator Platform ProRealTime
DMI Double Divergence Pro for ProRealTime
Bearish and Bullish

Tri-Star candlestick pattern

The Tri-Star is an exceptionally rare and significant three-candle pattern that signals an impending, aggressive trend reversal. First identified by…

Bearish and Bullish

Three Line Strike

The Three Line Strike is a rare and visually dramatic four-candle pattern that presents a unique paradox in technical analysis.…

Bearish and Bullish

Trading the Side-By-Side White Lines: An Institutional Guide to Trend Acceleration

While basic trend-following strategies look for standard pullbacks to enter a market structure, quantitative models focus heavily on continuation patterns…

Bearish and Bullish

Trading the Separating Lines: An Institutional Blueprint for Momentum Re-Acceleration

In systematic trend-following, identifying points where an asset pauses to trap counter-trend traders before violently resuming its primary direction is…

Bearish and Bullish

Trading the Meeting Lines: An Institutional Guide to Structural Equilibrium

In systematic technical analysis, identifying the exact coordinates where an aggressive market auction hits an immediate wall of opposing liquidity…

Bearish and Bullish

Marubozu candlestick pattern

The Marubozu is one of the most powerful and straightforward single-candle formations in technical analysis. Translated from Japanese, Marubozu means…

Bearish and Bullish

Long Legged Doji

The Long-Legged Doji is a single-candle pattern that signifies a state of dramatic, high-volatility equilibrium. It represents a fierce battle…

Bearish and Bullish

Kicking candlestick pattern

The Kicking candlestick pattern is one of the most reliable and aggressively directional two-candle formations in technical analysis. It represents…

Bearish and Bullish

Harami Cross candlestick pattern

The Harami Cross is a highly potent, two-candle reversal pattern that signals a sudden halt in market momentum. In Japanese,…

Posts pagination

1 … 44 45 46 … 50

You missed

Indicator MultiCharts .NET

Advanced Moving Average Indicator for MultiCharts .NET

Indicator Ninjatrader Platform

Advanced Moving Average indicator for NinjaTrader 8

Divergence Indicator Platform ProRealTime

DMI Double Divergence Pro for ProRealTime

Tradingview

How to Create a Custom Indicator in TradingView: A Step-by-Step Guide

Copyright @ 2026 Patternsmart - All rights reserved