In the realm of modern quantitative trading and technical analysis, Multi-Timeframe (MTF) indicators are frequently touted as a “panacea” for capturing major trends. Many traders constantly search for tools that can display long-period trends on short-term charts. However, as the core developer of the TPR (Trend Pullback Reversal) indicator, I must state unequivocally: the TPR indicator does not have an MTF version now, nor will one be introduced in the future.
This decision is not a technical compromise. Instead, it is a deliberate, proactive choice based on rigorous cross-platform architectural design, market microstructure research, and live-trading signal synchronization.
1. Empirical Comparison: “Trend Judgment Latency” in Cross-Period Calls
To more intuitively understand the drawbacks of MTF, we can observe signal performance via live trading charts (such as a side-by-side comparison of a 5-minute chart and a 15-minute chart).
If we forcibly load or reference a 15-minute trend calculation stream on a 5-minute chart, the system exposes severe logical flaws and execution lag at identical timestamps. Below are specific anchor-point comparison examples:
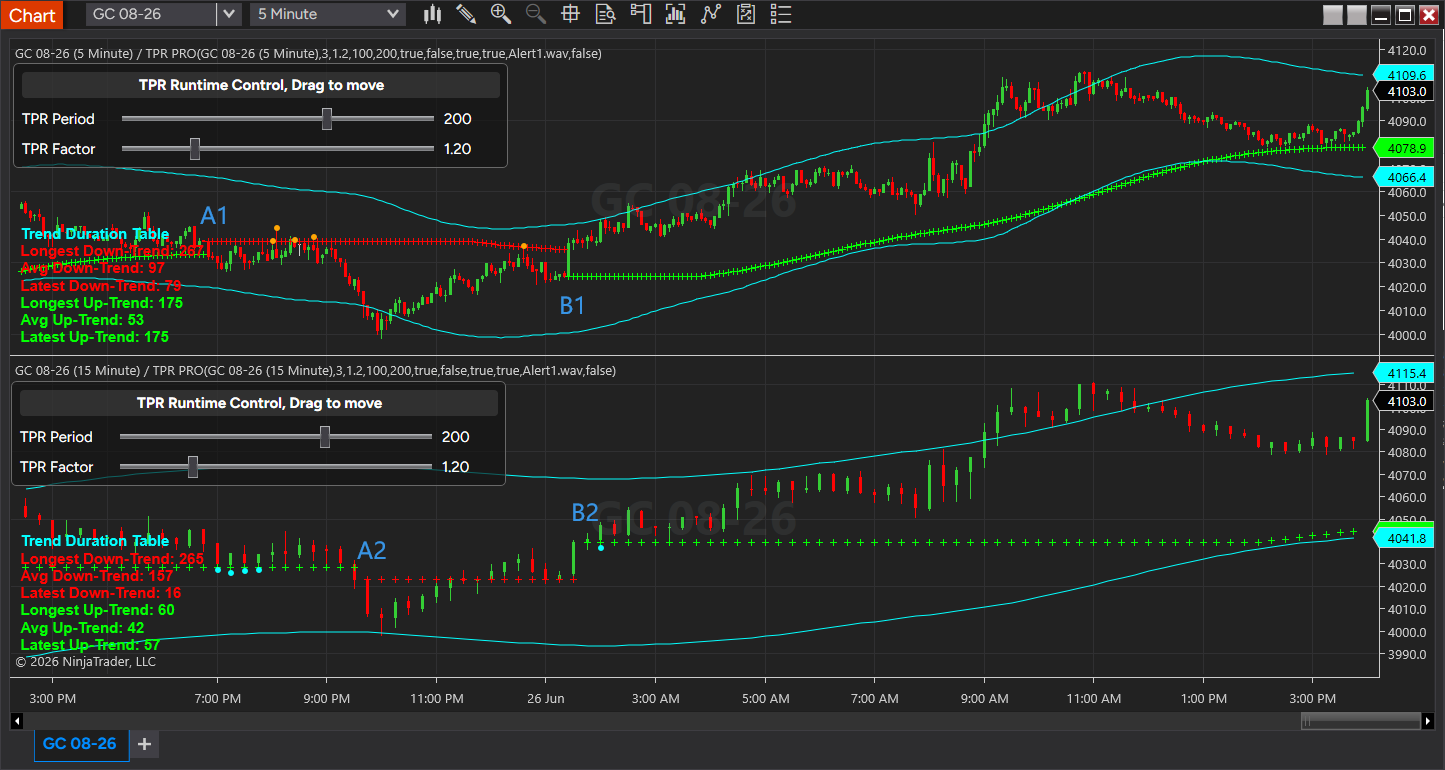
Case A: Delay in Establishing a Short Trend (Comparing Anchor Points A1 and A2)
- Micro-Chart Performance (Point A1): At position A1 on the 5-minute chart, based on the dynamic boundary calculations of the current timeframe, the system has already acutely captured the price’s valid breakdown below the lower band, continuously printing definitive short trend markers. At this stage, the micro-execution side has already initiated dynamic tracking.
- Cross-Period Chart Performance (Point A2): However, at the exact same timestamp, because the 15-minute candlestick has not yet closed, the long-period trend stream on the 15-minute chart (at position A2) has only just completed its short confirmation.
- Execution Consequence: If decisions are made on a lower-frequency chart based on the long period, A2 introduces a severe lag of numerous candlesticks compared to A1. This delay in trend judgment causes traders to enter the market hindsightfully long after the short move has already developed significantly, completely destroying the risk-to-reward ratio.
Case B: Delay in Long Trend Reversal (Comparing Anchor Points B1 and B2)
- Micro-Chart Performance (Point B1): As the market bottoms out and rebounds, the 5-minute chart at position B1 has already established the launch of a long trend at the earliest possible moment via a valid crossover of the upper band, beginning to print long tracking markers.
- Cross-Period Chart Performance (Point B2): Meanwhile, at the exact same point in time on the 15-minute chart (position B2), the long-period indicator stream is only just printing its very first long marker.
- Execution Consequence: A massive time and price gap exists between B1 and B2. Using MTF logic to call the long period on a micro-chart means traders will only see the long signal around B2, by which time the price has often moved far away from the optimal left-side or critical entry point.
Empirical Conclusion
- Latency is Directly Proportional to Timeframe Size: As shown in the coaxial comparisons of (A1, A2) and (B1, B2), forcing cross-period calls introduces unavoidable lag. If a 60-minute or higher timeframe trend is called, this latency deteriorates exponentially, rendering the signals on the micro-chart completely obsolete.
- Inability to Correctly Judge Critical Reversals and Pullbacks: The soul of TPR lies in capturing granular, localized price action tests. Once higher-timeframe, fragmented “staircase” data is introduced, micro-touch markers and potential visual rebound hints cannot align precisely with the high and low prices of the current candlestick, causing the system to distort completely during V-shaped reversals or rapid pullbacks.
2. Eliminating the Underlying Risks of Look-Ahead Bias and Repainting
In cross-platform quantitative architectures (such as Pine Script, C++, C#), MTF indicators suffer from a universal and fatal logical flaw: Repainting.
When streaming data from a higher timeframe is bridged to a lower timeframe, the output value of a single higher-timeframe candlestick constantly fluctuates until it officially closes.
- The Backtesting Trap: In historical static data, systems often retroactively apply the finalized closed results of the higher timeframe, leading to extraordinarily flawless backtest curves (i.e., deception via look-ahead bias).
- The Live-Trading Disaster: In live trading, the dynamic lines of the higher timeframe continuously rewrite signal points across past timestamps as price fluctuates violently, directly causing traders to trigger executions at incorrect positions.
The TPR indicator was designed from the ground up to provide absolutely definitive, irreversible trend and pullback signals. By strictly restricting it to the current chart timeframe, TPR ensures that every visual marker printed on the screen is based on the definitive data of the current time series, completely eradicating repainting.
3. Perfect Alignment with Price Action: Micro-Interactions Between Raw Candlesticks and Dynamic Channels
The core value of TPR is to capture the dynamic balance among Trend, Pullback, and Reversal. This balance must be meticulously observed through the candlestick patterns on the current chart.
Absolute Synchronization of Vision and Logic
If cross-period compression is forced upon the indicator, the lines will display “staircase-like” gap artifacts on shorter timeframe charts. These gaps directly disrupt the following core observations:
- Instantaneous Touching of Dynamic Boundaries: Traders need to observe in real-time whether the current candlestick’s price action precisely touches or breaks through the dynamically calculated upper and lower boundaries of the channel.
- Micro-Positioning of Signal Points: Visual markers, such as potential rebounds, are generated based on the relative relationship between volatility and price location within the current timeframe. Once separated from the current chart timeframe, the relative positions of the candlesticks and indicator lines become distorted, preventing users from correctly judging whether a move constitutes a valid test of dynamic support or resistance.
Keeping the indicator 100% consistent with the chart timeframe allows traders to clearly and intuitively see how price “breathes” within the channel and how it is supported or resisted at the boundaries, achieving a seamless “what you see is what you can instantly execute” experience.
4. Avoiding “Cognitive Overload” from Macro Noise on Micro Execution
At the level of trading psychology and system execution, multi-timeframe setups frequently introduce unnecessary cognitive overload. When a trader observes a clear, localized pullback entry opportunity on a lower-timeframe chart, if a macro trendline from a higher timeframe is simultaneously loaded on the same chart, the trader will often hesitate due to the perceived resistance from the macro period, ultimately missing the optimal swing trading window.
TPR advocates a trading philosophy of “Focus on the Present, Close the Logical Loop”:
- Single-Timeframe Independence: If you are trading on a specific chart timeframe, you only need to focus on the trend status, channel boundaries, and trend duration performance (such as the number of consecutive trend bars recorded in the tool table) under that specific timeframe.
- Multi-Chart Linkage Instead of MTF: A superior trading architecture should not scramble all dimensions of information onto a single chart. Instead, it should implement independent multi-period analysis through multi-screen or multi-chart linkages (e.g., opening a higher-timeframe chart and a lower-timeframe chart simultaneously), allowing each to serve its respective function.
5. High Efficiency and Performance Optimization of Cross-Platform Architecture
From a quantitative system architecture perspective, a single-timeframe design significantly enhances the operational efficiency of the TPR indicator across different platforms—whether in cloud-based scripting environments or C++/C# trading systems pursuing ultimate concurrency.
| Architectural Dimension | Single-Timeframe TPR Design (Chart Timeframe) | Traditional MTF Indicator Design |
| Memory & Computing Resources | Only needs to cache the historical series of the current instrument; low computational complexity, extremely lightweight. | Must simultaneously request, align, and store historical series across multiple timeframes; easily triggers platform quota limits. |
| Cross-Platform Alignment | Extremely simple logic; output results achieve 100% mirrored alignment across all platforms. | Underlying alignment mechanisms for high and low timeframe data vary by platform; highly prone to signal discrepancies. |
| Data Latency | Millisecond-level real-time calculation; tightly follows the subtlest movements of the current price. | Suffers from synchronization delays in cross-period data subscriptions, impacting instantaneous execution for high-frequency or precision swing trading. |
Conclusion
The power of the TPR indicator lies not only in its acute ability to capture the launch of trends and the exhaustion of pullbacks, but also in its design restraint and purity.
As demonstrated by the actual latency cases of (A1, A2) and (B1, B2), rejecting an MTF version is done to maximize non-repainting definitiveness, interactive micro-price action, and low-latency execution. We advise users of TPR to embrace the “single chart timeframe” design philosophy and focus their eyes on the intimate contact between the current-level candlesticks and the indicator channels—for that is the true holy land where high-quality, low-latency trading signals are born.