Skip to content

PatternSmart.com

  • Store
  • Technical analysis
    • Indicator Concepts
    • Market Analysis
    • Coding Logic
    • Case Studies
    • Bearish and Bullish
    • Bearish Patterns
    • Bullish Patterns
    • Support and Resistance
    • Dynamic Supply Demand Zone
    • Divergence Analysis
  • Services
    • Customization
    • Conversion
    • White-Label
    • Co-op
  • Platform
    • cTrader
    • Metastock
    • MT4
    • MT5
    • Multicharts
    • MultiCharts .NET
    • Ninjatrader
    • ProRealTime
    • Sierra Chart
    • Thinkorswim
    • Tradingview
  • Symbol
    • Crypto
    • Forex
    • Futures
    • Stocks
  • Contact Us
  • About Us
Top Tags
  • Double Divergence
  • Multi Time Frame (MTF)
  • NinjaTrader
  • CCI Divergence
  • RSI Divergence
  • nt8
  • CCI Double Divergence

Latest Post

Advanced Moving Average Indicator for MultiCharts .NET Advanced Moving Average indicator for NinjaTrader 8 DMI Double Divergence Pro for ProRealTime How to Create a Custom Indicator in TradingView: A Step-by-Step Guide Chart Pattern Wedge for TradingView: Automated Rising & Falling Wedge Scanner Chart Pattern Triangle Indicator for TradingView Chart Pattern Rectangle for TradingView Chart Pattern Pennant for TradingView Chart Pattern Channel for TradingView
cTrader Divergence Divergence Analysis Forex Indicator Indicator Concepts Market Analysis Support and Resistance Technical analysis TPR

USDJPY Momentum Double Divergence & TPR Confluence Analysis on cTrader: Macro Bearish Resumption Across Multi-Range Frameworks

Indicator Concepts Technical analysis TPR

Why the TPR Indicator Refuses a Multi-Timeframe (MTF) : Real-Time Precision vs. Structural Lag

Chart Pattern Chart Patterns Indicator Technical analysis Tradingview

Chart Pattern Wedge for TradingView: Automated Rising & Falling Wedge Scanner

Chart Pattern Chart Patterns Indicator Technical analysis Tradingview

Chart Pattern Triangle Indicator for TradingView

Chart Pattern Chart Patterns Indicator Indicator Concepts Tradingview

Chart Pattern Rectangle for TradingView

Chart Pattern Chart Patterns Indicator Indicator Concepts Platform Technical analysis Tradingview

Chart Pattern Pennant for TradingView

Chart Pattern Chart Patterns Indicator Indicator Concepts Platform Tradingview

Chart Pattern Channel for TradingView

  • Latest
  • Popular
  • Trending
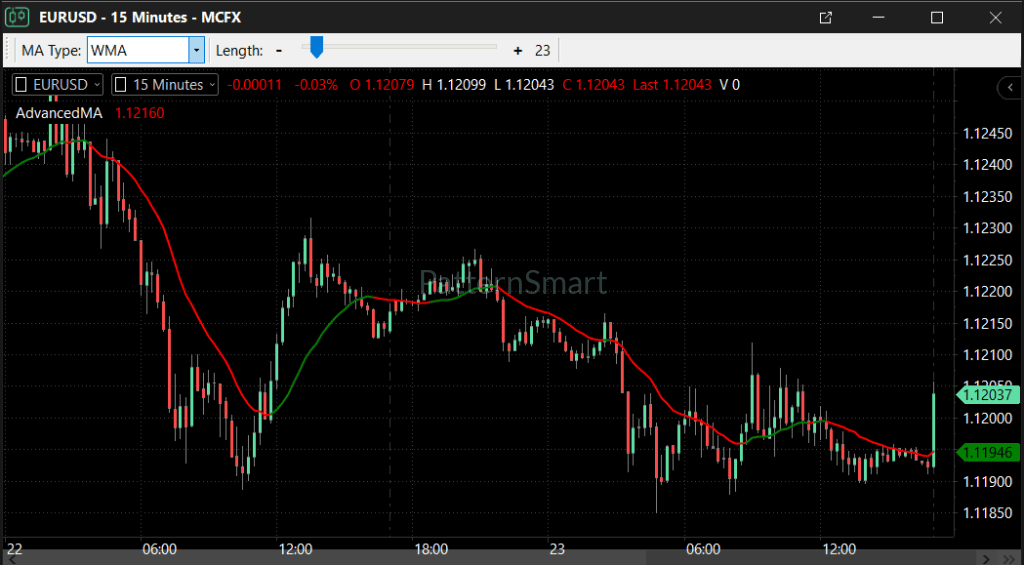
Advanced Moving Average Indicator for MultiCharts .NET
Indicator MultiCharts .NET
Advanced Moving Average Indicator for MultiCharts .NET
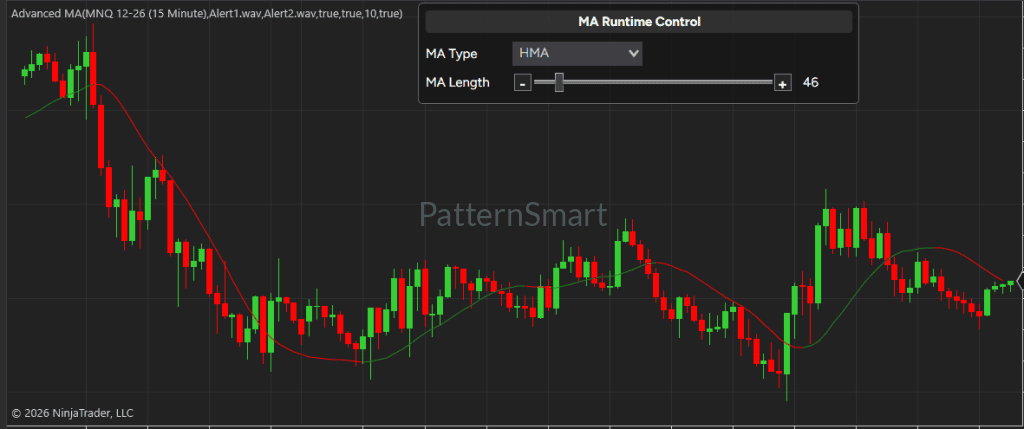
Advanced Moving Average indicator for NinjaTrader 8
Indicator Ninjatrader Platform
Advanced Moving Average indicator for NinjaTrader 8
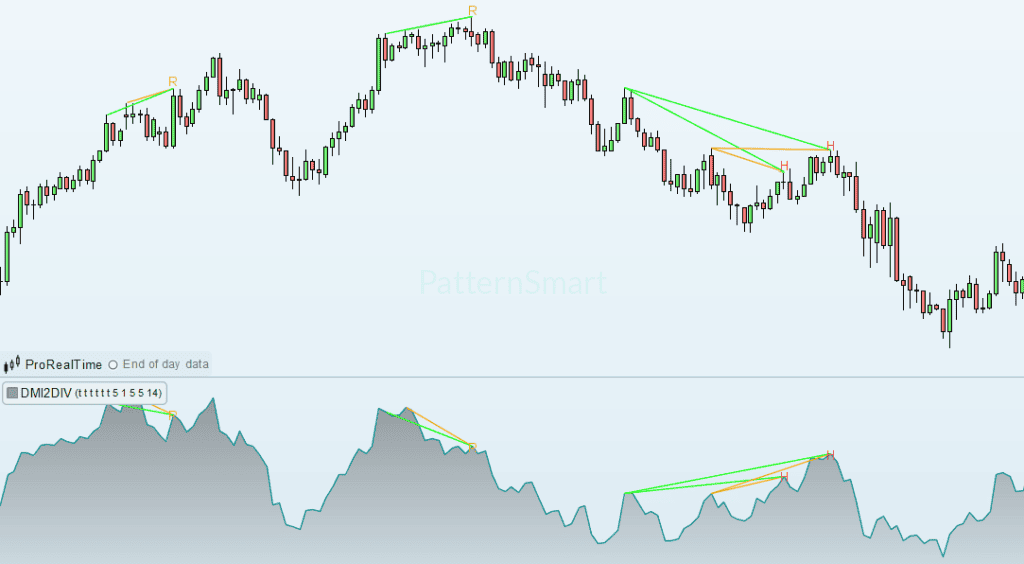
DMI Double Divergence Pro for ProRealTime
Divergence Indicator Platform ProRealTime
DMI Double Divergence Pro for ProRealTime
Indicator Ninjatrader
Super Scalper indicator custom NinjaTrader NT8 indicator
Indicator
Super Trend indicator advanced edition custom thinkorswim TOS indicator
Indicator Thinkorswim
3 Level ZigZag Session High Low Indicator custom thinkorswim TOS indicator
Advanced Moving Average Indicator for MultiCharts .NET
Indicator MultiCharts .NET
Advanced Moving Average Indicator for MultiCharts .NET
Advanced Moving Average indicator for NinjaTrader 8
Indicator Ninjatrader Platform
Advanced Moving Average indicator for NinjaTrader 8
DMI Double Divergence Pro for ProRealTime
Divergence Indicator Platform ProRealTime
DMI Double Divergence Pro for ProRealTime
Bearish and Bullish

Harami candlestick pattern

The Harami is a foundational two-candle reversal pattern that signals a sudden contraction in market volatility and a potential shift…

Bearish and Bullish

Engulfing candlestick pattern

The Engulfing candlestick pattern is one of the most powerful and frequently observed two-candle reversal setups in technical analysis. Unlike…

Bearish and Bullish

Breakaway candlestick pattern

The Breakaway candlestick pattern is a rare and complex five-candle reversal formation that maps a multi-day transition in market sentiment.…

Bearish and Bullish

Belt Hold candlestick pattern

The Belt Hold candlestick pattern (known as yorikiri in Japanese candlestick charting) is a sharp, single-candle reversal formation that signals…

Bearish and Bullish

Abandoned Baby candlestick pattern

The Abandoned Baby is an exceptionally rare, highly reliable three-candle reversal pattern that marks a clean, psychological break in market…

Bullish Patterns

Hammer candlestick pattern

The Hammer is one of the most recognizable and powerful single-candle reversal patterns in technical analysis. Found at the base…

Bullish Patterns

Upside Tasuki Gap candlestick pattern

The Upside Tasuki Gap is a relatively rare but highly reliable three-candle bullish continuation pattern. Found within strong, established uptrends,…

Bullish Patterns

Upside Gap Three Methods candlestick pattern

The Upside Gap Three Methods is a highly reliable, five-candle bullish continuation pattern that develops within a strong, accelerating uptrend.…

Bullish Patterns

Unique Three River Bottom candlestick pattern

The Unique Three River Bottom is a rare, three-candle bullish reversal pattern that typically forms at the end of a…

Posts pagination

1 … 45 46 47 … 50

You missed

Indicator MultiCharts .NET

Advanced Moving Average Indicator for MultiCharts .NET

Indicator Ninjatrader Platform

Advanced Moving Average indicator for NinjaTrader 8

Divergence Indicator Platform ProRealTime

DMI Double Divergence Pro for ProRealTime

Tradingview

How to Create a Custom Indicator in TradingView: A Step-by-Step Guide

Copyright @ 2026 Patternsmart - All rights reserved