The Three Line Strike is a rare and visually dramatic four-candle pattern that presents a unique paradox in technical analysis. While its massive fourth candle looks like a violent, trend-ending reversal, it is statistically classified as a trend continuation pattern.
When it prints on a chart, it represents a massive, single-period “liquidity grab” or a shakeout designed to trap counter-trend traders right before the original trend aggressively resumes.
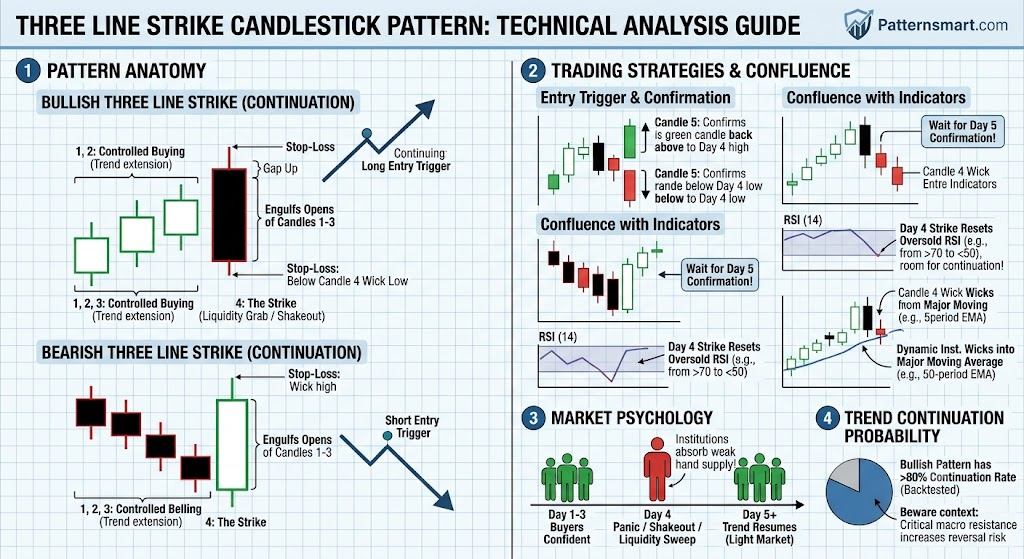
Anatomy of the Three Line Strike
The pattern occurs in two distinct structures depending on the prevailing market trend: Bullish and Bearish.
The Bullish Three Line Strike
- Prior Trend: The asset must be in a well-defined uptrend.
- Candles 1, 2, & 3: Three consecutive bullish (green/white) candles form. Each candle should post a higher close than the previous one, progressing steadily upward like a staircase.
- Candle 4 (The Strike): A massive bearish (red/black) candle opens higher than the previous session (or gaps up) but completely reverses downward. By the closing bell, this single candle’s real body engulfs the opens of all three preceding bullish candles.
The Bearish Three Line Strike
- Prior Trend: The asset must be in a clear downtrend.
- Candles 1, 2, & 3: Three consecutive bearish (red/black) candles march lower, making progressive new lows.
- Candle 4 (The Strike): A massive bullish (green/white) candle opens lower but surges aggressively upward, closing above the opening price of the very first candle in the series.
The Market Psychology: The Ultimate Bear/Bull Trap
Understanding the psychological mechanics of Candle 4 is key to trading this pattern effectively. Let’s look at the breakdown of a Bullish Three Line Strike:
- Days 1–3 (Controlled Buying): The market rises healthily. Buyers are in total control, pushing prices up in a standard, predictable trend extension.
- Day 4 (The Liquidity Sweep): Profit-taking triggers a minor drop, which rapidly accelerates into a cascading selloff. Early buyers panic and exit their long positions, while overeager bears read this as a definitive structural breakdown and flood the market with short orders.
- The Behind-the-Scenes Reality: Institutional algorithms and large market players utilize this concentrated selling pressure as a massive pool of liquidity to fill their large long buy orders at a discount. Even though the day finishes deeply negative, the underlying supply has been entirely swept up. The trend is now light, purged of weak hands, and ready to skyrocket.
How to Trade the Three Line Strike
Because the fourth candle looks so incredibly bearish (or bullish in a downtrend), amateur traders often make the fatal mistake of trading in the direction of the “Strike.” Professional traders do the exact opposite.
1. The Entry Trigger (The Waiting Game)
Do not buy blindly at the immediate close of the massive fourth candle. You must wait for Candle 5 to act as confirmation.
- Bullish Setup: Wait for Candle 5 to open and cross back above the close or midpoint of Candle 4. Once price movement moves back in the direction of the macro trend, your long entry is triggered.
- Bearish Setup: Wait for Candle 5 to push down below the close of the large bullish strike candle.
2. Precise Stop-Loss Placement
Risk management is highly structured with this pattern due to the clear extremes created by the strike candle:
- Long Position: Place your stop-loss just below the lowest point (the wick low) of Candle 4. If the price drops past this level, the liquidity pool failed to hold, and the macro trend is compromised.
- Short Position: Place your stop-loss just above the absolute highest wick high of Candle 4.
3. Essential Confluence Rules
Because the fourth candle is highly volatile, look for secondary metrics to validate your bias:
- Relative Strength Index (RSI): In a Bullish Three Line Strike, the sharp drop on Day 4 often cools off an overbought RSI, resetting the indicator back down toward the 50 line and creating room for a healthier rally.
- Moving Averages: The low of Candle 4’s massive wick will frequently wick directly into a major moving average (like the 20-period or 50-period EMA) and immediately bounce, proving dynamic institutional support is active.
Trend Continuation vs. Reversal Probability
According to quantitative backtests popularized by charting experts, the Bullish Three Line Strike is statistically one of the most reliable continuation indicators available, yielding a trend-continuation accuracy rate exceeding 80% in steady bull markets.
Conversely, if the pattern prints when an asset is testing critical multi-year macro resistance, its probability of acting as a true reversal pattern increases. Always cross-reference the pattern with your higher time-frame market structure to ensure you are riding the correct wave.
Please check our Bearish and BullishPatterns Indicator collection.