The Tri-Star is an exceptionally rare and significant three-candle pattern that signals an impending, aggressive trend reversal. First identified by Steve Nison, the pioneer of Western candlestick charting, this pattern communicates a state of total, paralyzing indecision in the market before a violent pivot.
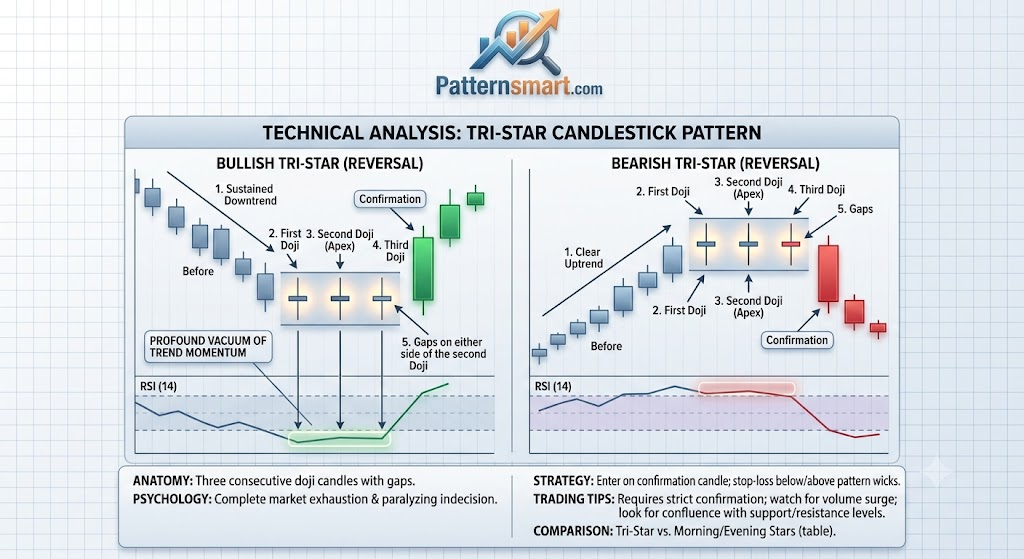
What makes the Tri-Star so unique is its composition: it consists entirely of three consecutive Doji candlesticks.
Anatomy of the Tri-Star Pattern
The Tri-Star pattern exists in two variations: Bullish (at the bottom of a downtrend) and Bearish (at the peak of an uptrend).
To qualify as a valid Tri-Star pattern, the formation must adhere to strict structural criteria:
The Bullish Tri-Star (Bottom Reversal)
- Prior Trend: The market must be locked in a clear, sustained downtrend.
- First Doji: Forms in alignment with the downtrend, showing that sellers are beginning to lose the momentum required to make a lower close.
- Second Doji: The market gaps downward on the open, but buyers manage to push the price back up to close exactly at or near the open price. This middle Doji acts as the low point (the “apex”) of the pattern.
- Third Doji: The market gaps upward on the open. This third consecutive session closes right where it opened, confirming a failure to renew selling pressure.
The Bearish Tri-Star (Top Reversal)
- Prior Trend: The market must be in a well-defined uptrend.
- First Doji: Buyers face sudden resistance, resulting in an equal open and close.
- Second Doji: The market gaps upward into a fresh high, but closes at its open, creating an isolated top Doji.
- Third Doji: The market gaps downward. Buyers fail to mount a recovery, resulting in the final consecutive Doji.
The Market Psychology: Severe Indecision
A single Doji indicates that bulls and bears are locked in an exact tie—the open and close are virtually identical. When three Dojis align sequentially, it implies the market’s underlying mechanics are undergoing a massive transition:
- Day 1 (Initial Crack): The dominant side (e.g., bears in a downtrend) hits a wall. For the first time in a while, they cannot push a lower close.
- Day 2 (The Over-Extension): The dominant side tries one last push via an opening gap, but the opposing force absorbs all of the volume. By the closing bell, the price is flat. This is the moment of peak exhaustion.
- Day 3 (The Balance Tips): The market opens with a gap in the opposite direction. Neither side can make substantial headway during the session, but the structural shift is obvious: the trend has lost its directional bias entirely.
Trading the Tri-Star Pattern
Because the Tri-Star pattern is so rare, its occurrence is heavily scrutinized by institutional algorithms and professional traders. When it does appear, it is considered highly potent.
1. Wait for Confirmation
Entering a trade precisely on the third Doji is dangerous because the market is still mathematically in equilibrium.
- For a Bullish Tri-Star: Wait for Candle 4 to open and close as a strong bullish (green) body above the middle Doji’s high.
- For a Bearish Tri-Star: Wait for Candle 4 to break below the lowest point of the three Dojis.
2. Risk Mitigation & Stop-Loss Placement
Due to the clear geometric levels created by the gaps, risk management is incredibly straightforward:
- Bullish Position: Enter on Candle 4 confirmation. Place your stop-loss 1–2 pips below the lowest wick of the middle (second) Doji.
- Bearish Position: Enter on short confirmation. Place your stop-loss 1–2 pips above the highest shadow of the middle (second) Doji.
3. Confluence Rules
Because three Dojis can sometimes form during low-volume periods (such as holiday trading), you must ensure the pattern has statistical backing:
- Volume Analysis: Volume should steadily dry up over the three Doji days, followed by a massive surge in volume on the confirmation candle.
- Support/Resistance Check: A Bullish Tri-Star carries immense weight if the second Doji taps a multi-month historical horizontal support line.
Comparison: Tri-Star vs. Morning/Evening Stars
The Tri-Star is often considered the extreme cousin of the traditional Morning and Evening Star formations:
| Pattern | Candle 1 | Candle 2 (Apex) | Candle 3 | Reliability |
| Morning Star | Large Bearish Body | Small Body (Green/Red) | Large Bullish Body | High |
| Evening Star | Large Bullish Body | Small Body (Green/Red) | Large Bearish Body | High |
| Tri-Star | Doji | Doji | Doji | Very High (Very Rare) |
While Morning and Evening stars rely on strong trend-directional candles on either side of the star, the Tri-Star derives its predictive power purely from the profound vacuum of trend momentum across three whole sessions, making it one of the most definitive psychological turning points in chart analysis.
Please check our Bearish and Bullish Patterns Indicator collection.