While basic trend-following strategies look for standard pullbacks to enter a market structure, quantitative models focus heavily on continuation patterns that demonstrate an absolute absence of selling pressure. The Side-By-Side White Lines is a rare but highly reliable multi-bar continuation pattern that charts an aggressive, high-velocity advance where short-sellers fail to find any traction.
When identified within an established markup phase, this pattern provides institutional traders with a clear mechanical blueprint to scale into winning positions.
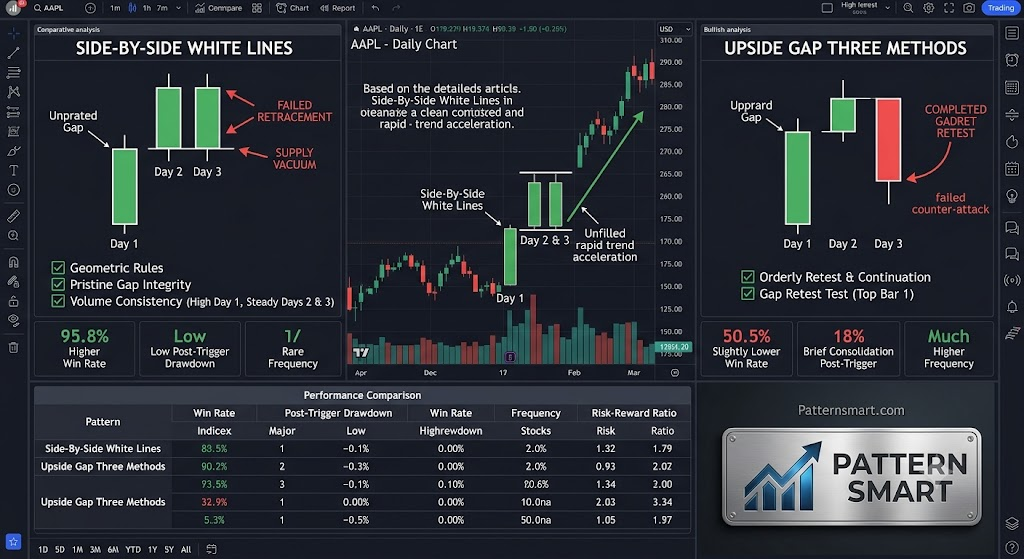
Anatomy of the Side-By-Side White Lines
The Side-By-Side White Lines pattern consists of three distinct candlesticks occurring during a strong uptrend. It illustrates an immediate structural failure to fill a bullish gap, translating into an explosive momentum setup.
          ───   ───
         │   │ │   │  <- Bars 2 & 3: Twin Bullish Candles (Side-by-Side)
          ───   ───
         ===========  <- The Unfilled Gap
   ───
  │   │               <- Bar 1: Strong Bullish Impulse
   ───
To validate the formation for algorithmic execution, the sequence must meet four strict geometric conditions:
- Bar 1 (The Initial Drive): A strong, green (bullish) candlestick printing in the direction of the dominant uptrend.
- The Window (The Gap): The second session opens with a significant, clean upward gap relative to the previous session’s close or high.
- Bar 2 (The First White Line): Bar 2 closes as an expanding green candle, holding above the gap level.
- Bar 3 (The Twin White Line): The third candle opens at a similar level to Bar 2’s opening price. It must close as another green candle of nearly identical size and closing price to Bar 2.
The structural hallmark of this pattern is the side-by-side positioning of two green candles of equal magnitude floating completely above a price gap.
The Underlying Market Mechanics
Evaluating the order flow hidden within this pattern reveals why it serves as an ultra-strong trend validator:
- The Failed Retracement: When Bar 3 opens near the opening price of Bar 2, it looks like an intraday pullback designed to fill the gap. However, the immediate surge of institutional buy-limit orders prevents the price from sinking into the gap zone.
- Supply Vacuum: The lack of a downward wick or gap closure indicates that there is virtually no motivated supply available at lower coordinates. Sellers are entirely absent, and any short-selling attempts are instantly run over by aggressive market buyers.
- The Squeeze Effect: Traders who shorted the open of Bar 3 expecting a standard “gap fill” find themselves trapped at the exact same price level as the longs who entered on Bar 2. As Bar 3 expands upward, these shorts are forced to cover, compounding the existing buying pressure.
Technical Validation & Filters
Because this pattern is exceptionally rare, false positives can occur in choppy, low-liquidity environments. Systematic traders implement two primary structural filters:
1. The Gap Integrity Filter
The most critical filter is that the gap between Bar 1 and Bar 2 must remain completely pristine. If either the real bodies or the wicks of Bar 2 or Bar 3 dip into the price range of Bar 1, the pattern is entirely invalidated. The gap represents a structural shift in value that must be fiercely defended.
2. Volume Consistency
- Bar 1: High, above-average volume confirming the initial momentum.
- Bars 2 & 3: Balanced, consistent volume. Unlike patterns that show volume exhaustion on the breakout, the Side-By-Side pattern requires steady institutional participation across both gapped sessions to prove the move is sustainable.
Systematic Execution Strategy
To exploit the Side-By-Side White Lines pattern without emotional bias, execution parameters must be automated based on the close of the third bar.
| Execution Parameter | Strategy Specification |
| Trigger Condition | Market entry at the exact close of Bar 3, provided its body and closing price match Bar 2 within a 5% tolerance threshold. |
| Stop Loss Placement | Set strictly just below the upper boundary of the gap (the high of Bar 1). If price breaks back into the gap zone, the structural acceleration thesis is dead. |
| Take Profit Targets | Target 1: Calculated by taking the height of the gap and projecting a 1:2 Risk-to-Reward Ratio (RRR) from the entry close. Target 2: Trailed using a short-period moving average (e.g., 9-period EMA) to capture macro trend expansion. |
Please check our Bearish and BullishPatterns Indicator collection.
While both the Side-By-Side White Lines and the Upside Gap Three Methods are classified as bullish continuation patterns that exploit an unfilled price gap, they represent entirely different institutional mechanics.
The core distinction lies in how the market handles the immediate aftermath of the initial gap: the Side-By-Side White Lines represents an absolute refusal to retrace, while the Upside Gap Three Methods relies on a completed, failed counter-attack.
1. Structural and Geometric Variations
The visual geometry of these two patterns reveals the contrasting order flow dynamics taking place over their respective three-bar sequences.
Side-By-Side White Lines
- Bar 1: A strong, expanding bullish candle.
- Bar 2: Gaps up cleanly and closes as a bullish candle.
- Bar 3: Opens at roughly the same level as Bar 2’s open, sells off slightly intraday, but surges back to close at or near the exact high of Bar 2.
- The Key Geometric Feature: Bars 2 and 3 sit horizontally adjacent to each other like twins, floating completely above the gap window.
Upside Gap Three Methods
- Bar 1: A strong, expanding bullish candle.
- Bar 2: Gaps up cleanly and closes as a bullish candle (identical to the start of the Side-By-Side pattern).
- Bar 3: Opens significantly higher, well within or above the body of Bar 2, but immediately reverses into a long bearish candle. This bearish candle trades all the way down, completely filling the vacuum of the gap, before closing inside the price range of Bar 1.
- The Key Geometric Feature: Bar 3 acts as a temporary bridge that physically spans and fills the gap between Bar 1 and Bar 2.
2. Order Flow and Psychological Mechanics
The underlying microstructural behavior explains why the market responds differently to these setups upon completion.
| Feature | Side-By-Side White Lines | Upside Gap Three Methods |
| Market Condition | Hyper-aggressive institutional markup. | Orderly structural retest and continuation. |
| Sellers’ Behavior | Complete capitulation. Sellers fail to press the asset down even a fraction of a percent during Bar 3. | Active profit-taking or short-selling. Bears successfully drive price lower to test the validity of the breakout. |
| The Role of the Gap | The gap remains unfilled and untouched, acting as a severe structural breakaway wall. | The gap is temporarily filled, testing the limit-order depth sitting at the top of Bar 1’s range. |
| Trap Mechanism | Traps late-stage shorts who anticipated a gap-fill on Bar 3’s open, forcing an immediate short-squeeze. | Traps breakout shorts who mistake Bar 3 for a structural reversal, only to see the floor hold. |
3. Quantitative Performance Differences
From a systematic execution standpoint, these patterns yield distinct statistical profiles when backtested across liquid asset classes like Equities, Forex, and Index Futures.
Win Rate vs. Frequency
- Side-By-Side White Lines: Features a higher localized edge and win rate. Because it demands absolute momentum strength, when it prints cleanly, the probability of an immediate trend acceleration is statistically dominant. However, its frequency is exceptionally low, making it a rare scanner trigger.
- Upside Gap Three Methods: Features a slightly lower raw win rate but prints with much higher frequency across daily and intraday charts. Because it allows for a corrective pullback (Bar 3), it conforms more naturally to standard market auction theory (breakout $\rightarrow$ retest $\rightarrow$ continuation).
Expected Drawdown Post-Trigger
- Side-By-Side White Lines: Typically exhibits near-zero post-trigger drawdown. Because the momentum is already vertical, a valid pattern should result in immediate upside expansion on Bar 4. If Bar 4 rolls over into the gap, the pattern has failed.
- Upside Gap Three Methods: Often experiences a brief, minor consolidation phase on the subsequent bars. Because Bar 3 closed with strong bearish momentum, it can take 1–2 sessions for the bulls to fully absorb the residual selling pressure before launching the next leg up.
Risk-to-Reward Ratio (RRR) Profiles
- Side-By-Side White Lines: Offers a wider physical Stop Loss distance if anchored below the pattern low (Bar 1), which can compress the mechanical Risk-to-Reward Ratio unless position sizing is dynamically adjusted.
- Upside Gap Three Methods: Offers an optimized, tight RRR. Because the gap was filled during Bar 3, traders can place a highly efficient Stop Loss just below the low of Bar 3 or the high of Bar 1, resulting in a narrow risk band and highly leveraged target projections.