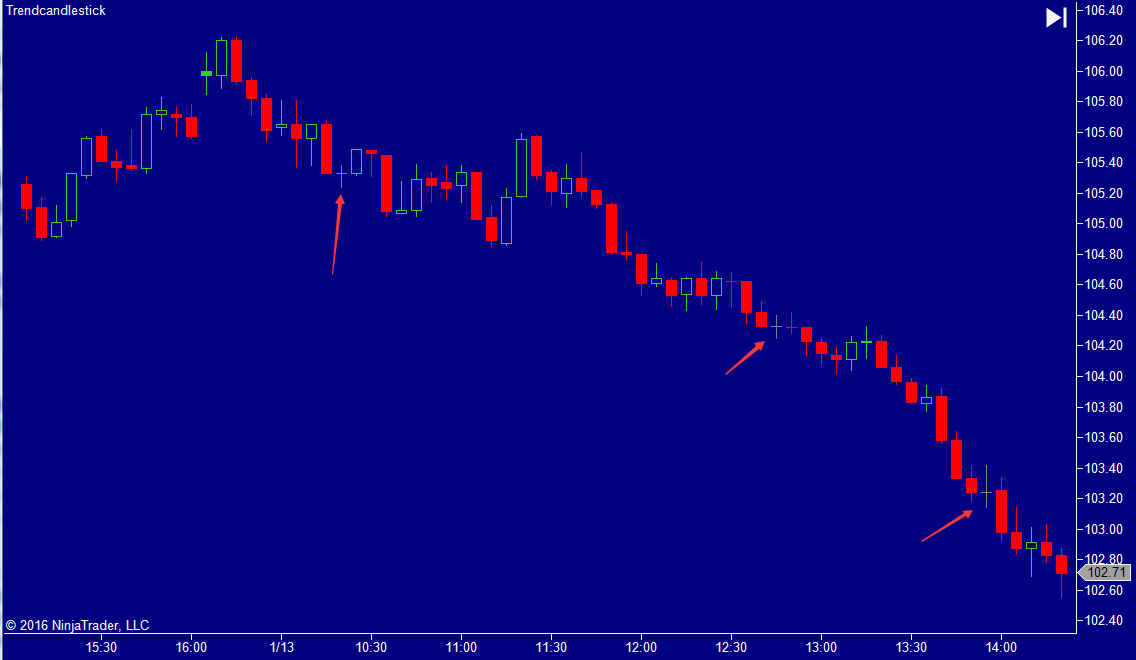
This candlestick chart type will show a candle is outlined in positive color if the current close price is higher than that on the previous time period.
On the contrary, if the current close price is lower than that on the previous period, the candle is outlined in negative color.
If close prices on the current and the previous time periods are equal or if the candle is the first on the chart, the candle is then outlined in Flat color.
If the close price is lower than the open price and close price is higher than the previous one, it is filled with positive color. The candlestick will be solid green. Otherwise, it is hollow candlestick.
If the close price lower than the open price and close price is lower than the previous one, it is filled with negative color. The candlestick will be solid red. Otherwise, it is hollow candlestick.
If the candlestick outlined in Flat color has the close price lower than the open price, it is filled with Neutral tick color. Otherwise, it is left unfilled.