VIP price is: $59
Reversal means a change in the direction of a price trend.
A bearish reversal shows that pressure to sell overcomes pressure to buy.
The turning point of the bearish reversal should be considered as a resistance level.
A bullish reversal shows that buyers are taking control.
The turning point of the bullish reversal should be considered as a support level.
Every trader wants to know where and when a reversal will happen.
But there is no method to confirm the turning point with 100% accuracy.
The only way to confirm the occurrence of a reversal is after the fact.
However, the price level of the turning point proves to be very useful for future indications.
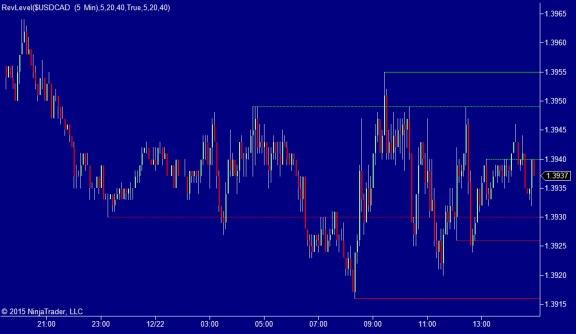
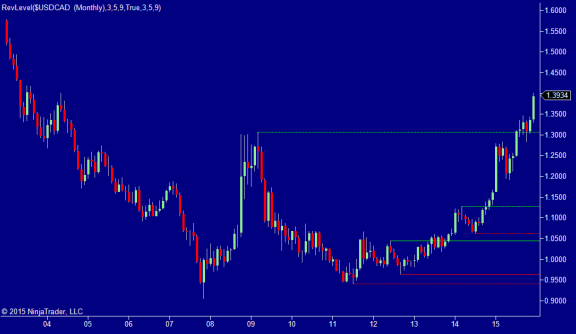
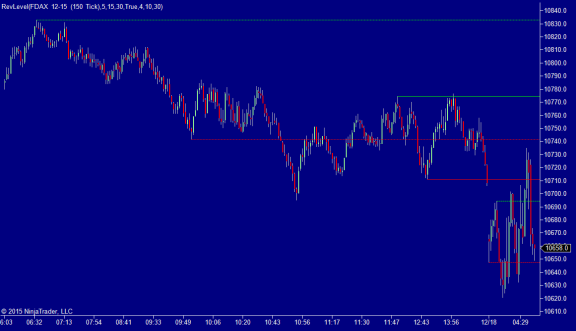
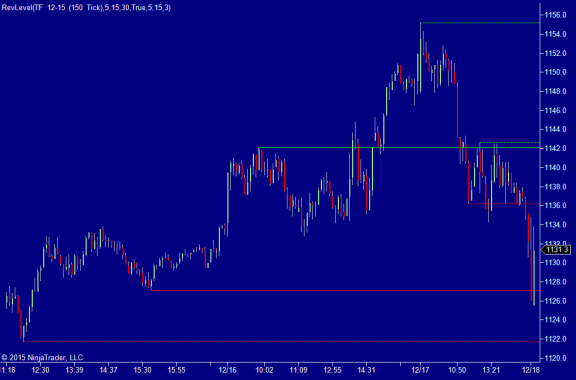
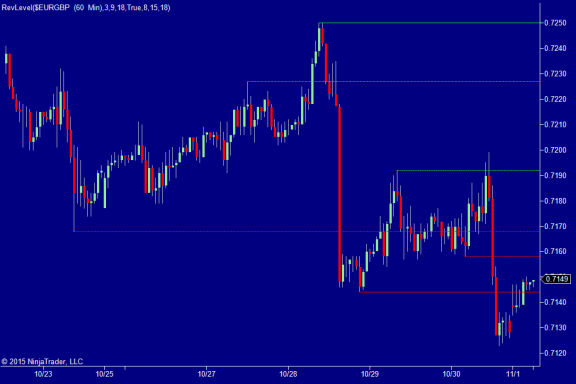
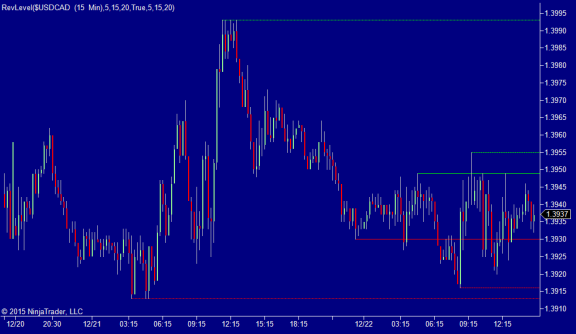
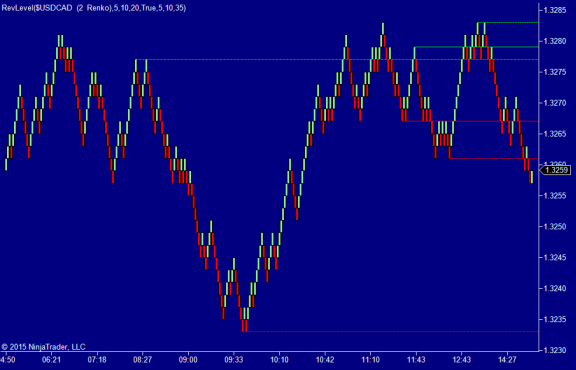
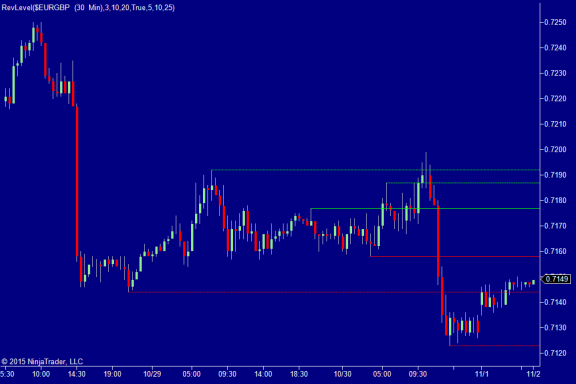
This Reversal Level indicator plots six price levels from previous reversals’ turning point.
These lines are used as support and resistance levels for current trend.

Parameters: LowerLvL1 to LowerLvL3 and UpperLvL1 to UpperLvL3 are Number of bars used to confirm the lower and upper reversal levels.
The concept is easy to understand, if you set LowerLvL1 to a small number such as 5, the first lower level line will be plotted from a minor reversal point.
If you set LowerLvL3 to a large number such as 30, the 3rd lower level line will be plotted from a major reversal point. It works the same way on UpperLvL input.
How to use:
We suggest to set the LowerLvL1 and UpperLvL1 to a relatively small number, such as 5.
Then the first lower line and first upper line can be considered as short-term support and resistance levels.
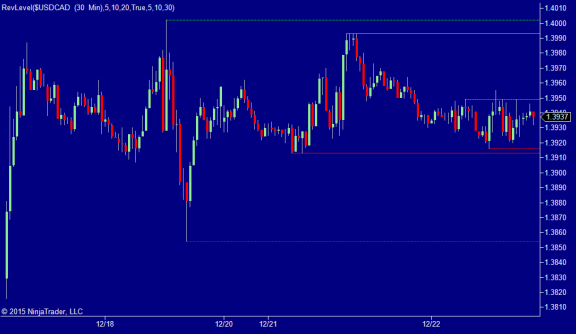
You can set the LowerLvL2 and UpperLvL2 to a median number bewteen LvL1 and LvL3.
Then the 2nd lower line and 2nd upper line can be considered as mid-term support and resistance levels.
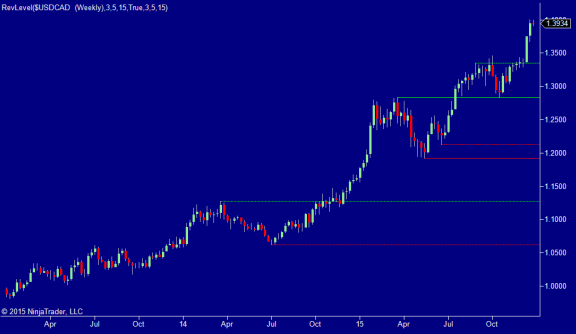
If you set LowerLvL3 and UpperLvL3 to large number, they will give you a price range for current trend, these two lines will be the major or long term support and resistance levels.
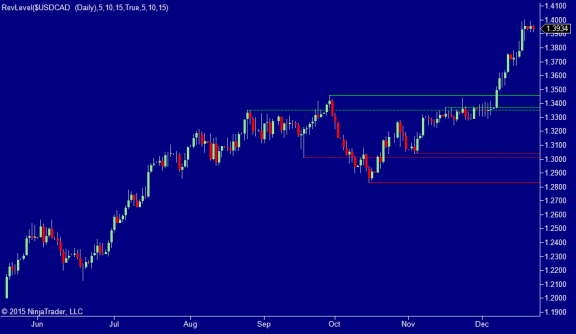
There are three major price trends: uptrend, downtrend and sideways.
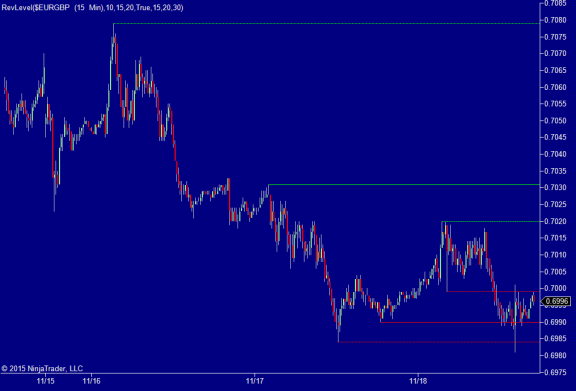
If the price bounces back after it hits a level line, there may be a reversal.
If the price breaks through an upper level line, the price may continue uptrend.
If the price breaks through a lower level line, the price may continue downtrend.
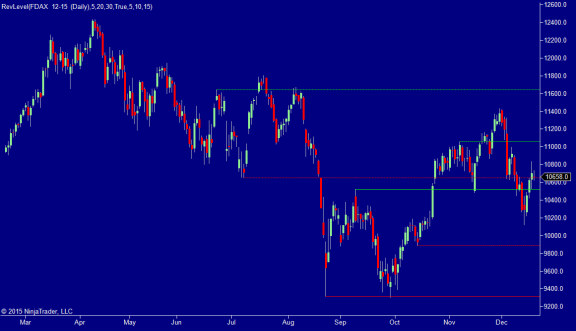
Please check the images below for details.
 |
 |
 |
 |
 |
 |
 |
 |
 |
 |
  |
  |
 |
|
It works on all time frame(Tick, Renko, Minutes, Daily, Weekly, Monthly, etc.) and all markets(Stocks, Futures, Forex, Options, ETF, etc.)
We will keep updating this indicator.
Please let me know your suggestions and ideas so that we can improve this indicator.
Please post your comments here: http://patternsmart.com/bbs/showthread.php?tid=16