The TPR(Trend Pullback Reversal) indicator forms a possible price trend with support and resistance lines.
It also comes with a unique band and center line as additional features.
TPR works on all timeframes and all symbols and all type of bar chart.
TPR never repaints.
There are 4 Parameters:
- Period: umber of bars used for calculations
- Factor: Multiplier factor, small number for short trend, large number for long trend
- Source: the input series, default is Close
- ShowBand: enable to show band and center line
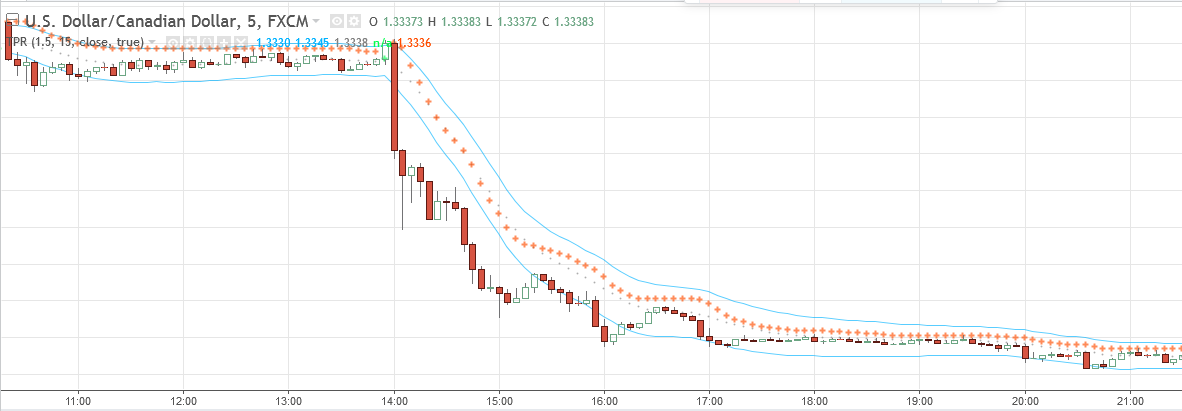
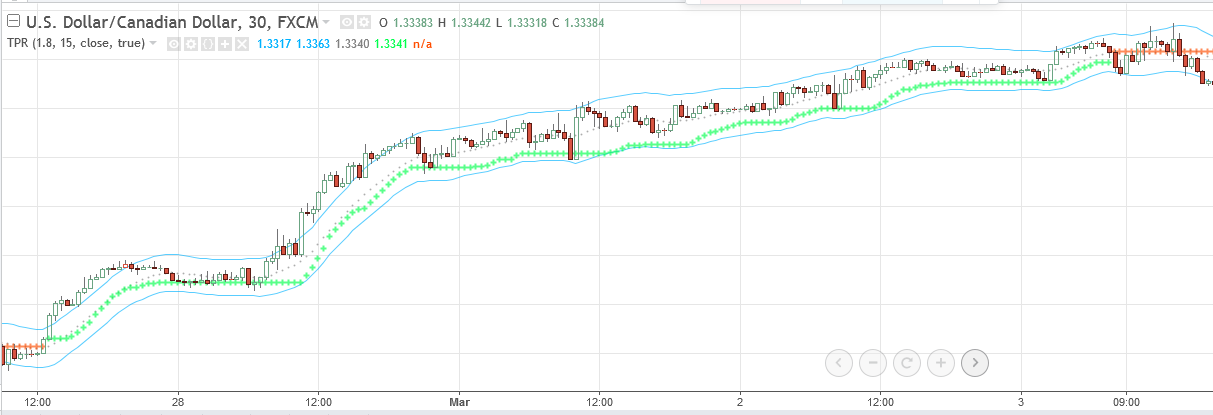
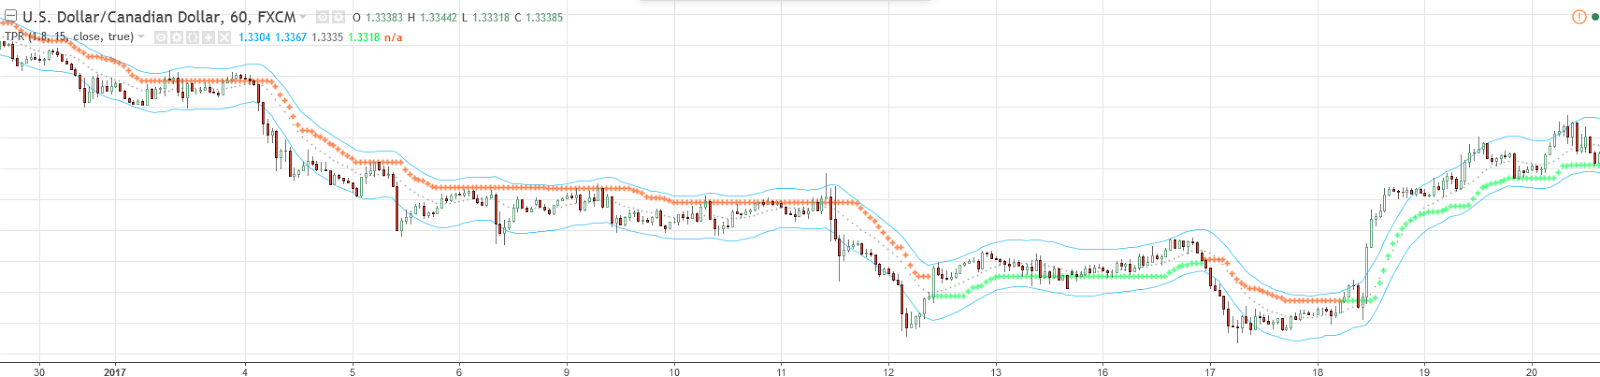
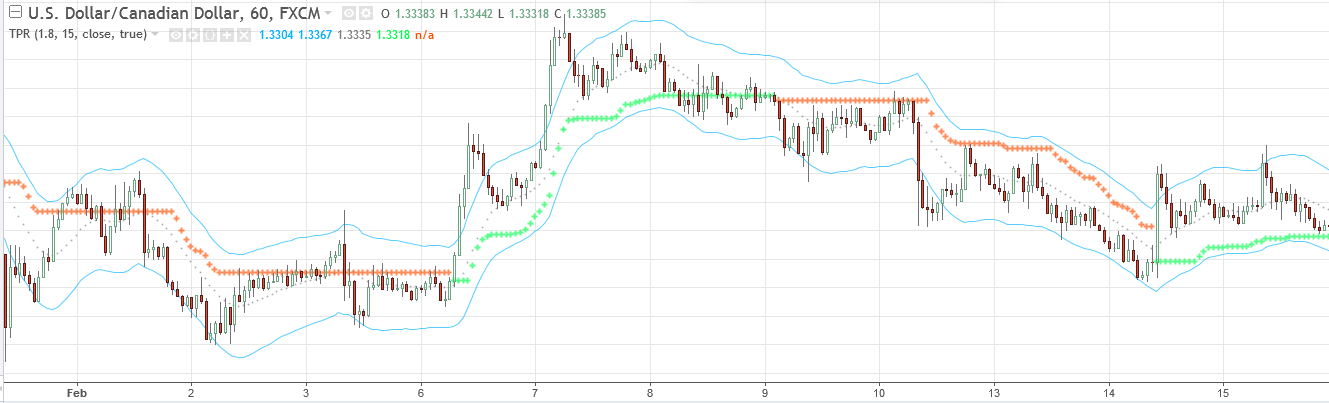
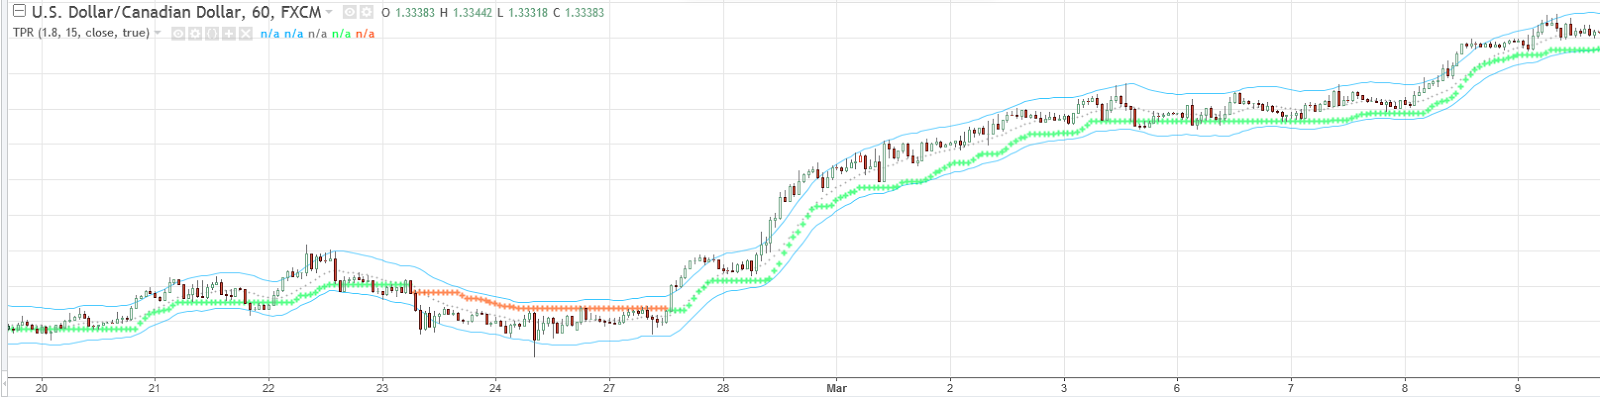
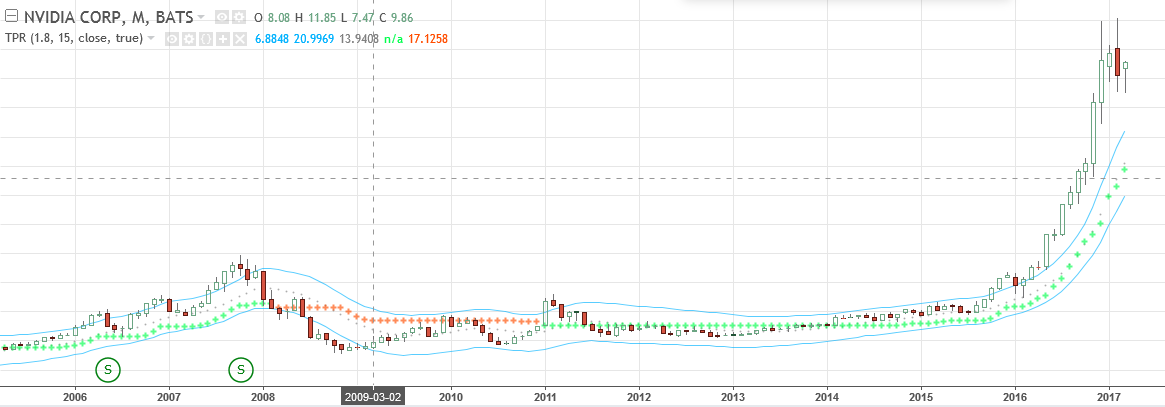
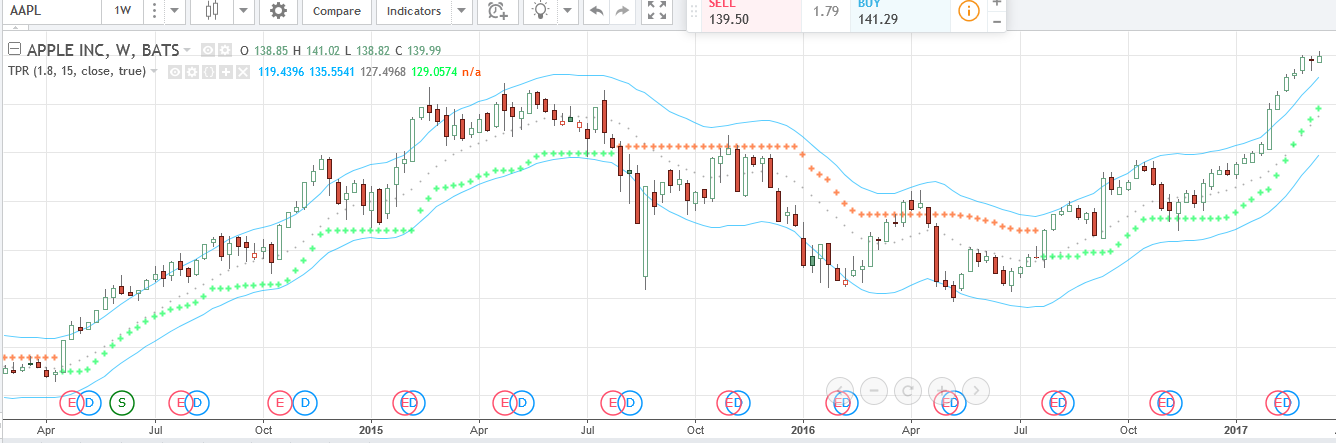
Most trend indicators have a similar plot, the difference is where and when they change the direction. Unlike other trend indicators, TPR will focus on the main trend and filter out most minor price movements. The green cross-line represents an uptrend, the red cross-line represents a downtrend.
The additional band and center line may look like bollinger band, but the TPR band algorithm is completely different from bollingerband. There is no standard deviation in TPR band calculation.
Click the image to view in original size.