The Upside Gap Three Methods is a highly reliable, five-candle bullish continuation pattern that develops within a strong, accelerating uptrend. Similar to the Upside Tasuki Gap, it represents a structural pause in the market—a moment where short-term profit-taking temporarily drives the price lower, only for an influx of institutional buying to immediately absorb the selling pressure and resume the dominant macro trend.
However, the Upside Gap Three Methods features a distinct structural characteristic: the third session completely fills the previous price gap, creating a powerful “liquidity purge” before the trend extends.
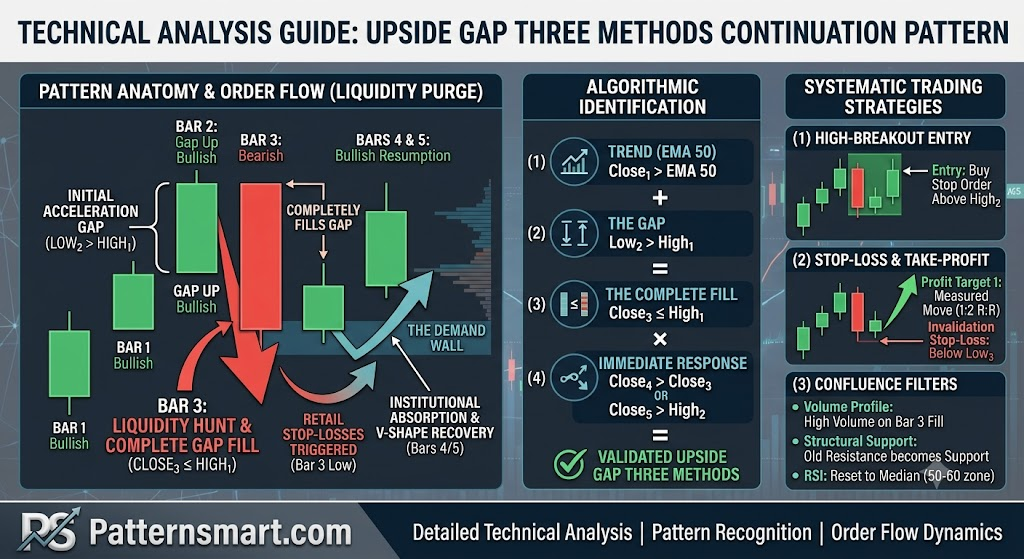
Structural Anatomy of the Pattern
The Upside Gap Three Methods consists of three primary structural phases distributed across five distinct candlesticks:
                  [Bar 2: Bullish]     [Bar 3: Bearish]     [Bar 4 & 5: Bullish]
                        +-+                  +-+                  +-+
                        | |                  | |                  | |
                        | |                  | |                  | |
                        +-+                  +-+                  +-+
  =============================================================   <-- Upper Gap Boundary
  =============================================================   <-- Lower Gap Boundary
[Bar 1: Bullish]
     +-+
     | |
     | |
     +-+
To classify a sequence as a valid Upside Gap Three Methods pattern, it must satisfy these strict spatial criteria:
- Bar 1 (The Trend Driver): A strong, long-bodied bullish (green/white) candlestick closing firmly within an established uptrend.
- Bar 2 (The Acceleration Gap): A second bullish candlestick that opens with a distinct gap up above the close of Bar 1. The low of Bar 2 must remain completely above the high of Bar 1.
- Bar 3 (The Gap-Fill Candle): A large bearish (red/black) candlestick that opens within or near the body of Bar 2 and moves completely downward. Crucially, Bar 3 must completely close the gap, meaning its close or low must plunge below the high of Bar 1.
- Bars 4 & 5 (The Resumption): Strong bullish candles immediately follow the gap fill, breaking back above the high of Bar 2 and confirming that the structural support floor held.
Market Psychology & Order Flow Dynamics
The pattern maps a classic institutional “liquidity hunt” or stop-run sequence within an active trend:
- The Breakout (Bars 1 & 2): Aggressive buying creates a physical gap. This price vacuum leaves behind an inefficiently traded zone often referred to as an imbalance or a Fair Value Gap (FVG).
- The Liquidity Purge (Bar 3): Late-stage breakout traders place their stop-loss orders directly within or just below the open gap window. Sensing this pool of liquidity, larger market participants pull their bids back, allowing a wave of profit-taking and aggressive counter-trend shorting to push the market down. This completely fills the gap and triggers the resting sell-stops.
- The Demand Wall (Bars 4 & 5): Once those stops are triggered and the gap is filled, price hits a heavy pocket of institutional buy limit orders. The sudden lack of sell orders combined with immediate institutional accumulation causes a rapid v-shape bounce, trapping the short-sellers who sold the gap fill.
Algorithmic Identification Criteria
To program an automated scanning indicator or strategy for this pattern, the logic must tightly constrain the spatial relationships of the first three candles while looking for immediate confirmation.
The mathematical filters can be written as follows:
$$Body_1 = Close_1 – Open_1 > 0$$
$$Body_2 = Close_2 – Open_2 > 0$$
$$Body_3 = Open_3 – Close_3 > 0$$
Quantitative Filtering Rules
An indicator script requires these conditions to execute concurrently:
- Trend Filter: $Close_1 > \text{EMA}(Close, 50)$ (Ensures strong macro-trend context).
- The Initial Gap: $Low_2 > High_1$ (Verifies a clean, unfilled gap window between Bar 1 and Bar 2).
- The Complete Fill: $Close_3 \le High_1$ (Confirms that Bar 3 has completely filled the gap by closing at or below the high of Bar 1).
- Immediate Response: $Close_4 > Close_3$ or $Close_5 > High_2$ (Demands immediate bullish validation following the fill).
Systematic Trading Strategies
Because Bar 3 represents a complete gap fill, trading this pattern requires waiting for the market to prove that the downward move was a temporary trap rather than a structural reversal.
1. The High-Breakout Entry Strategy
- Entry: Place a buy stop order slightly above the high of Bar 2. This guarantees that you are only triggered into the position when the market has fully recovered from the gap-fill decline and has reclaimed its upward velocity.
- Stop-Loss: Position the invalidation stop just below the low of Bar 3 (the lowest point of the gap-fill candle). If subsequent price action breaks below this level, it indicates that the drop was not a temporary liquidity purge, but a genuine regime shift to the downside.
- Take-Profit: Target a structural major resistance or project a measured move based on the height of the initial trend leg ($High_2 – \text{Trend Low}$), aiming for a minimum risk-to-reward ratio of 1:2.
2. Confluence and Volume Filtering
| Technical Variable | High-Probability Characteristic | Market Meaning |
| Volume Profile | Expanding volume on Bars 1 & 2; peak volume or a notable delta reversal on Bar 3. | High volume on Bar 3 followed by a bullish close on Bar 4 signals massive institutional absorption of retail stops. |
| Structural Alignment | The gap window overlaps with a prior Pivot High or an old resistance-turned-support zone. | Adds historical weight to the zone where the gap fill occurred, maximizing its likelihood of holding. |
| Oscillator Context | RSI cools down from an overbought reading ($>70$) back into the median range ($50\text{–}60$) during Bar 3. | Shows a healthy mathematical reset of momentum without damaging the macro bullish structure. |
Key Differences: Upside Gap Three Methods vs. Upside Tasuki Gap
While both patterns feature an identical opening sequence (Bars 1 and 2), their resolution handles liquidity differently:
- The Upside Tasuki Gap is a shallow retracement. Bar 3 only enters the gap window partially, showing that the bulls are so aggressive they won’t even allow a full gap test before buying again.
- The Upside Gap Three Methods is a deep retracement. Bar 3 completely fills the gap, wiping out short-term stops and testing the underlying structural support floor before driving higher. It is generally a more robust pattern for catching institutional turning points within a trend.
Please check our Bullish Patterns Indicator collection.